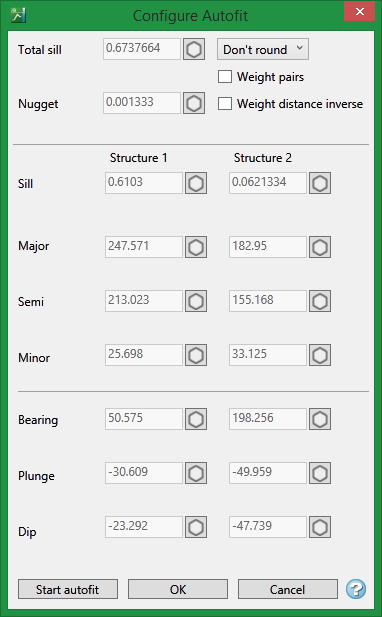
Configure Autofit
Click Autofit to display the Configure Autofit panel.
Limiting the region
To the left of the textboxes are small icon like those shown below. Each icon has three states. Click on an icon to change its state. These icons allow you to control how tightly the values are locked during the iterations.
From top to bottom the three states are:
![]() Freeze value - the value is not allowed to change.
Freeze value - the value is not allowed to change.
![]() Freeze region - the value is allowed to change only within 15%.
Freeze region - the value is allowed to change only within 15%.
![]() No Freeze - there is
no limit.
No Freeze - there is
no limit.
Total sill
This is the sum of the nugget plus the each of the sills of the nested structures. With the range icon set to Unfreeze or In range, you can enter the desired sill. If you do not know the exact sill, enter a number that is close. Start with a whole number or a number rounded to 0.5 and work from there. The sill you choose will not affect the model calculations. It will only affect how you are able to see it on the chart.
The total sill is equal to the nugget plus all the structures such that
Total Sill = Nugget + Structure1 + Structure2 + ... + Structure<n>
Nugget
You can enter the nugget obtained from the down hole variogram or enter another nugget. The default nugget is 0.
The nugget is the variance at an infinitely small separation distance.
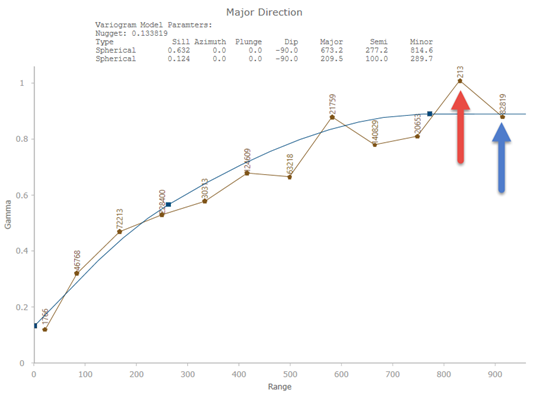
Weighted Pairs
Weighting is a way of preventing points made up of a low number of pairs from having too much influence on the modelled variogram. In the image below, the red arrow is pointing to a point that is made up of 213 pairs and the blue arrow is pointing to a point made up of 82,819 pairs. Notice how the model almost ignores the point made up of 213 pairs. That is because weighting has been applied. If no weighting had been applied then the model would have treated both points equally and would have shown less correlation than what actually exists.
Weight Distance Inverse
With Weight Distance Inverse, the greater the distance, the less influence a point will have. Select this option if you have points at the extreme ends of the experimental variogram that are made up of a large number of pairs. By weighting them this way their influence will be reduced.
Sill
This shows the sill for each structure.
Direction, Plunge and Dip
These show the results from each structure. In most cases, consideration should be given to what the geological orientation of the deposit is like verses what may result from an experimental variogram. Sampling errors or bias can effect the results of a variogram.
Start autofit
Click this to begin fitting your model. A progress bar will show you the progress. You can also hover your mouse over the Stop Autofit button to see how many iterations have been calculated and the error between one iteration and the next. You do not need to wait until the autofit function completes. You can stop it at any time. The model will be drawn in real time on the chart and you will be able to see the changes as the autofit function calculates through the iterations.
OK
Click to save the edits and exit the panel.
Cancel
Click to exit the panel without saving.

