Advanced Grade/Tonne Report
Use this option to produce a grade/tonnage report for chosen variables. The resulting report displays through the Report Window and, if desired, can also be outputted to nominated files.
Instructions
On the Block menu, point to Reserves, then click Advanced Grade/Tonne Report.
Follow these steps:
-
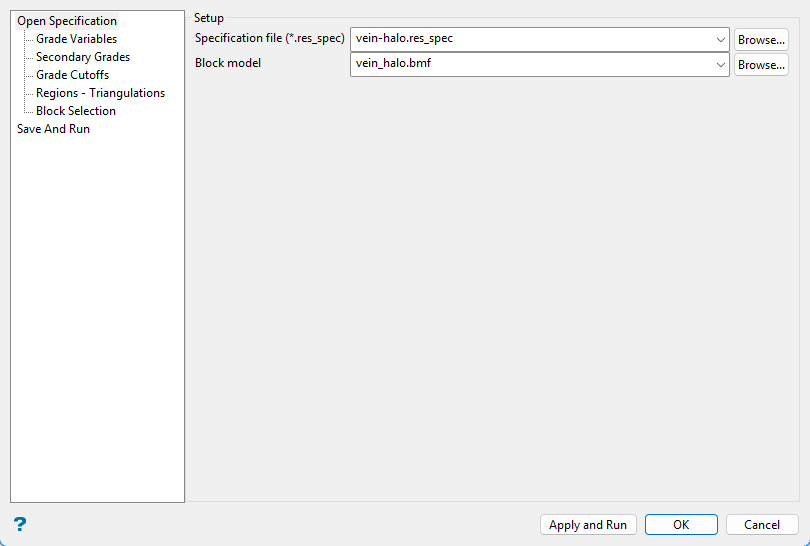
Enter, or select a Specifications file from the drop-down list. The drop-down list contains all of the
.res_specfiles found in your current working directory. Click Browse to select a file from another location.If you want to create a new specification file, enter the name of the new file. The file name, including the
.res_specfile extension, can be up to 512 alphanumeric characters in length. -
Select the Block model that will be used when calculating the block reserves. If a block model has been loaded prior to selecting the Advanced Grade/Tonne Report option, then it will be automatically selected.
The drop-down list contains all block models found within the current working directory. Click Browse to select a file from another location.
Grade Variables
Follow these steps:
-
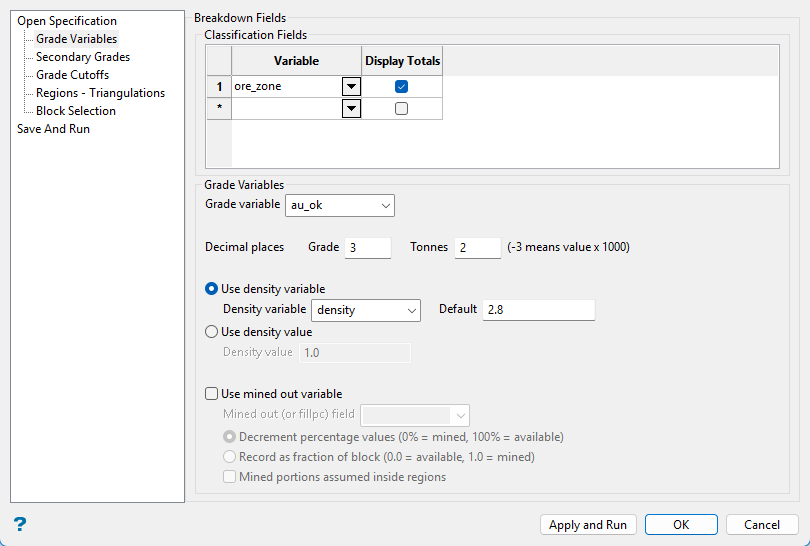
Select a Variable from the Classification fields grid.
These fields allow the specification of a breakdown variable so that reserves can be broken down according to fields, such as GEOLOGY or ORE_TYPE.
Example: GEOLOGY could be a field in the block model with the values: TQ1, TQ2, TQ3. Each of these different zones could form the basis for a breakdown of the reserves, with grades reported for each of the three geological types.
A breakdown variable type may be a Name, Byte, Short or Integer, but not a Float or Double.
-
Enter, or select the Grade variable from the drop-down list. This is the variable on which the report is based, and is referred to as the primary variable.
-
Enter the Decimal places to be displayed for the grade and tonnes figures.
-
Select Use density variable to use the values contained in a specific block model variable when calculating the tonnage. The desired block model variable can either be entered manually or selected from the drop-down list.
Alternatively, you can use a constant value when calculating the tonnage by selecting Use density value. You will need to specify the density value.
-
Enable Use mined out variable if you have a block model variable representing different regions in which you wish to evaluate.
ExampleWhen a block is evaluated against a region, the proportion of the block inside the region is determined. If the block has been partially mined, as indicated by a mined fraction or available percentage field, then the treatment of the mined part has two cases:
Case 1 - Incremental Pits
With Mined portions assumed inside regions enabled. If a previous pit has been used to set a mined field then the mined part of a block can reasonably be assumed to lie inside the new pit. It this case the proportion inside region volume is determined and then the mined out volume of the block subtracted. This method can be used to obtain accurate incremental pit volumes without the need to reblock the model. Diagram 1 shows a block inside a reserves region that has been 0.3 mined (70%) available.
Figure 1: Incremental Pits
Reserve volume = Volume in region - volume mined
= (Total Volume * 0.5) - (Total Volume * 0.3)
= Total Volume * 0.2
Case 2 - Underground Stope with Development
With Mined portions assumed inside regions not enabled. Triangulations of development may be used to set a mined field in a block model. In this case when evaluating a stope region the mined part of a block partly inside the region needs to be assumed equally distributed. Here the reserve volume is the product of the proportion in region volume and the percentage not mined. Diagram 2 shows a block 50% inside a reserves region that has been 0.3 mined (70% available).
Figure 2: Underground Stope with Development
Reserve volume = Volume in region * fraction not mined
= (Total Volume * 0.5) * (1 - 0.3)
= Total Volume * 0.35
Secondary Grades
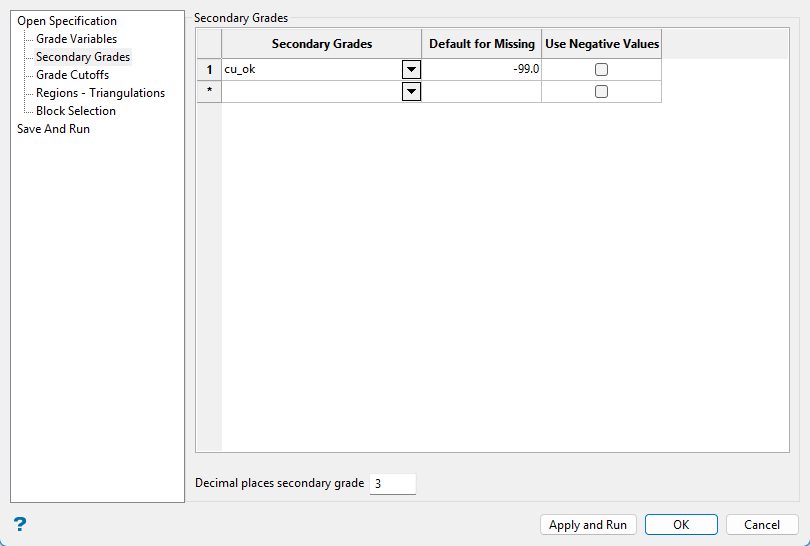
This section is optional and is used to include any additional secondary grade variables in the analysis.
Follow these steps:
-
Select the variables used to store the Secondary Grades using the drop-down lists. You can add a maximum of 100 additional variables.
-
Enter a value that will be used as a Default for Missing. If any block does not have a value assigned to the selected variable, this value will be used instead.
-
Select Use Negative Values if the secondary grade variable uses negative values. If negative values are used and this option is not selected then the negative values will be replaced with ZERO.
-
Enter the Decimal places secondary grade to be displayed for the secondary variables.
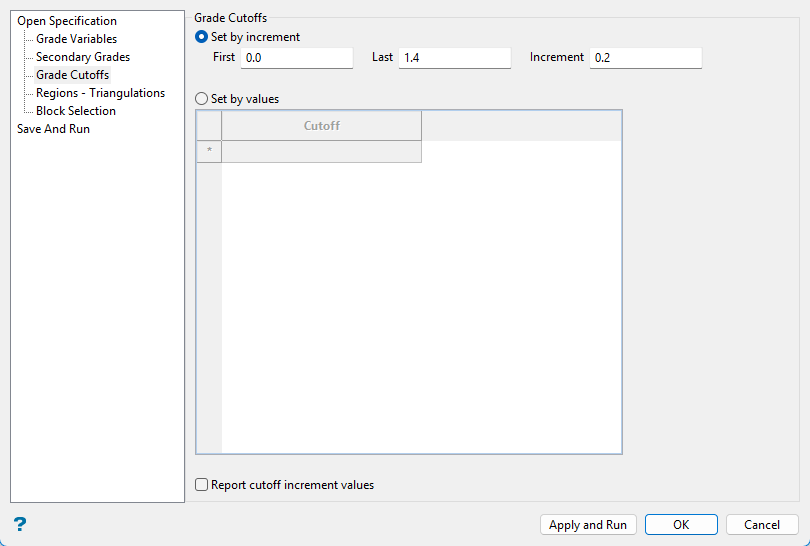
Grade Cutoffs
Follow these steps:
-
Select the Grade Cutoffs. You have two choices: either Set by increment or Set by values.
-
Set by increment - Select this option to use cut-off grades at regular intervals. You will need to specify the range between the first and last cut-off, and the increment value.
-
Set by values - Select this option to use cut-off grades at user-defined intervals. You will need to specify the values that you want to report (a maximum of 20 values).
-
-
Select Report cutoff increment values to report the increment values. The increment values displays in the resulting report.
Regions - Triangulations
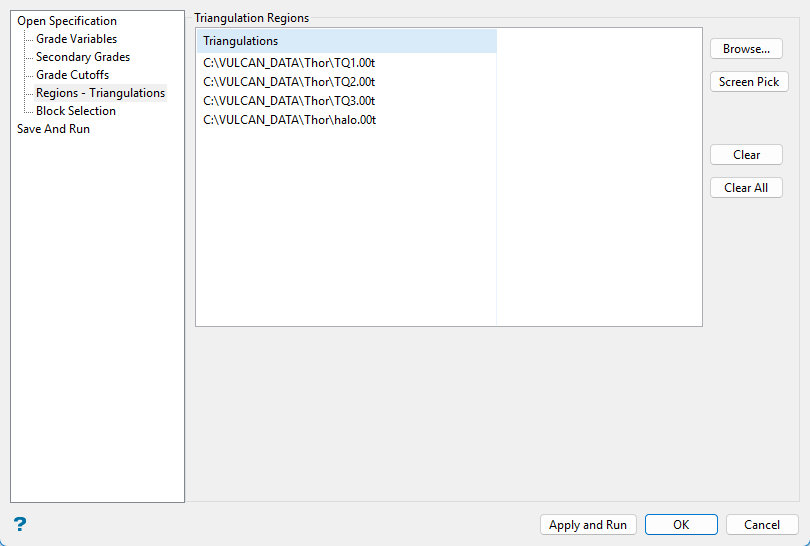
Use this section to include triangulations representing regions. The path names will be saved using the settings specified in Settings > Preferences > Paths/Directories option.
A maximum of 2,215 triangulations may be saved at once through this interface.
A single specification file (.res_spec) can contain up to 5,000 triangulations.
Triangulations can either be selected from the screen, or through browsing your local data directories.
To remove a triangulation, select the triangulation from the list and click the Clear option.
To remove a group of triangulations, use the left mouse option in combination with the Shift key to highlight the triangulations (this is for triangulations that are adjacent in the list, for non-adjacent triangulations use the Ctrl key and the left mouse option) and select Clear.
To remove all of the triangulations, select the Clear All option.
Note: Regions defined through this section of the interface will cause the bounding triangulation, which is nominated through the Block Selection section, to be ignored. Undesirable figures may be produced if your regions extrude outside the block selection solid. We recommend that you reblock the model to the block selection solid, flag the blocks inside with a value and then use this value as the block selection criteria.
Block Selection
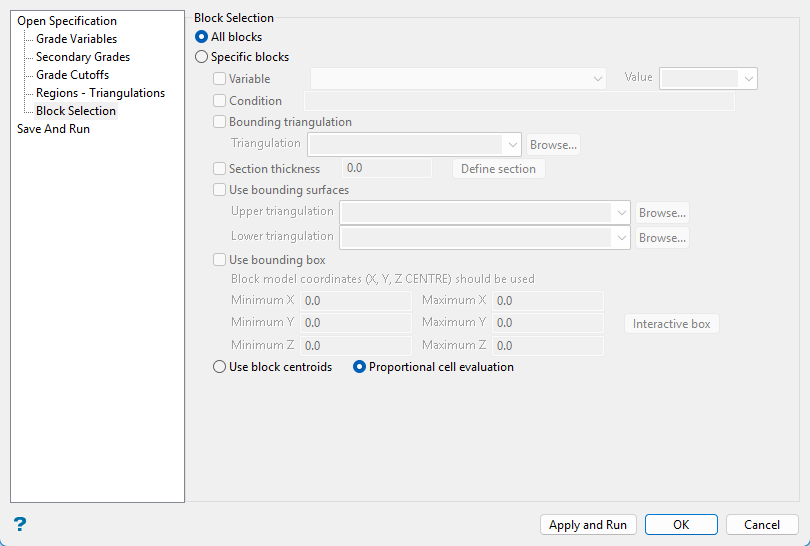
Use this pane to set up various block selection options.
-
Select either All blocks if you do not want to limit the blocks used, or Specific blocks to selects specific blocks based on selected criteria.
 Variable
You will need to specify the variable, as well as a particular value.
Example: If you have a variable called
Materialin your block model and want to restrict blocks to those where the material equals ore, selectMaterialas the variable and enteroreas the value. However, if you require all blocks that do not have this specified value, then enable the Reverse selection check box towards the bottom of the panel.Condition
You can limit the blocks by adding a condition on a numeric block model variable.
Example: To select blocks where iron has a value greater than 10.0, the condition would be
Fe GT 10.0The maximum size of the condition is 256 alphanumeric characters. Refer to Appendix B of the Core Appendices for a full list of available operators and functions.
Bounding triangulation
This is useful when you want to evaluate reserves in a particular solid triangulation, such as a stope.
Select the triangulation from the drop-down list. or click the Browse icon to select one from a location other than the top level of your current working directory.
Tip: To use all blocks outside of the selected triangulation, select the Reverse selection option in addition to the bounding triangulation.
Note: The bounding triangulation nominated through the Block Selection panel is ignored if any triangulation regions are specified.
Using a combination of block selection method produces approximate intersection volumes.Section thickness
This will restrict the blocks by a projection plane. You will need to enter its associated thickness. The blocks that are within that thickness will be selected.
The section plane can be selected by line, points, or grid coordinates. This information is entered through the Projection Plane panel, which displays upon clicking Define section.
Use bounding surfaces
Use this to restrict blocks to those that lie between two limiting surfaces.
Select the Upper triangulation and Lower triangulation from the drop-down lists, or click Browse to select a triangulation from a location other than your current working directory. Only blocks that lie in the overlapping sections of the surfaces, as viewed in plan view, are selected.
Use bounding box.
If you select this option, you must enter the minimum and maximum coordinates for X, Y, and Z in the block model coordinates (X, Y, Z CENTRE). If the block model origin is set at 0,0,0, then real world coordinates should be entered in the X, Y, and Z minimum and maximum coordinates. If the block model origin is set at real world coordinates, then enter coordinates for the bounding box that are offset a certain distance from the origin. The distance of offset will be determined by the dimensions of your bounding box. It will be the distance to the minimum and the distance to the maximum X, Y, and Z from the origin of the block model.
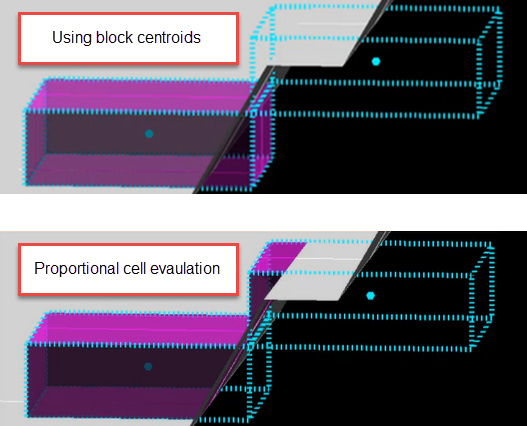
Use block centroids or Proportional cell evaluation
Decide whether you want to use the entire block or only the portion that is within the regional boundaries. This is especially important when using options such as Bounding triangulation, Bounding box, Section thickness, or Bounding surfaces.
Save And Run
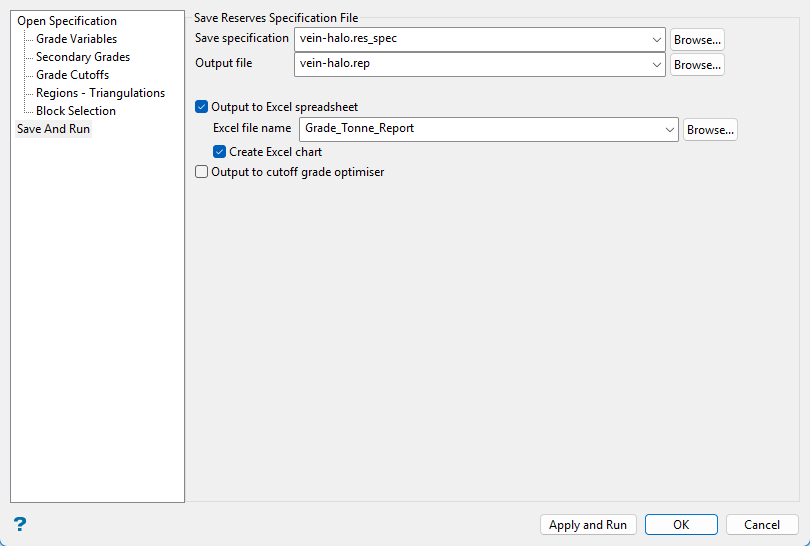
Follow these steps:
-
Save your specifications information.
The name of the currently open specification file, which was chosen through the Open Specification section, will be displayed. The drop-down list contains all (*.res_spec) files found in your current working directory. Click Browse to select a file from another location.
Important: If you select an existing file, then the values in the chosen file will be overwritten with the new specifications.
To create a new file, enter the file name and file extension. By default, the resulting file will be stored in the current working directory. Use the Browse option to select a different file location.
-
Enter the name of the Output file that will be used to store the resulting report (
.rep). The default file is 'Grade_Tonne_Report.rep'.The drop-down list contains all (
.rep) files found within your current working directory.Click Browse to select a file from another location.
To create a new file, enter the file name and file extension. By default, the resulting file will be stored in the current working directory. Use the Browse option to select a different file location.
-
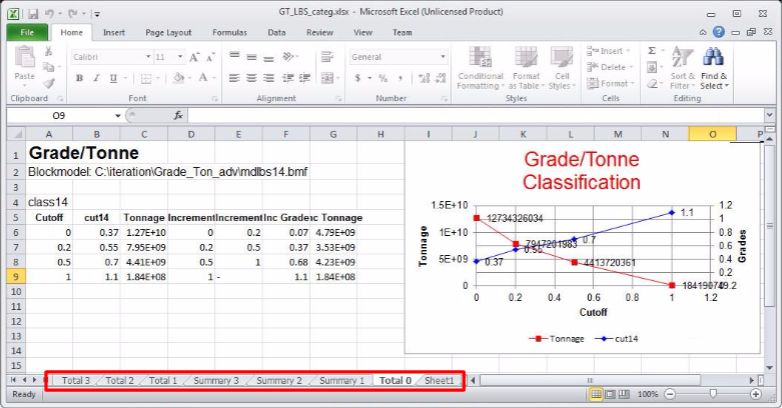
Select Output to Excel spreadsheet to send the resulting report to an Excel spreadsheet. You will need to select the Excel spreadsheet that will be used to store the resulting report (the default is 'Grade_Tonne_Report.xls'). The available drop-down list contains all .xls and .xlsx files found in your current working directory. Click Browse to select a file from another location.
To create a new file, enter the file name and file extension. By default, the resulting file will be stored in the current working directory. Use the Browse option to select a different file location.
-
Select Create Excel Chart to create an Excel chart from the resulting data. The sheet named Total 0 shows the totals, and Total n (n=1,2,3,...) shows the totals for different classifications values.
-
Select Output to Cutoff Grade Optimiser to output the report information to the C.O.G. format. See Block > Cut-Off Grade Optimiser > C.O.G. Optimiser Editor)
-
Click Apply and Run to save the specifications, as well as generate the report and all applicable output files.
Click OK to save the specifications.
Click Cancel to exit without saving.

