Overview
The options in the Variography submenu allow you to:
- create several styles of experimental (semi) variograms, for example, semi variogram, semi variogram of logarithms, pairwise relative semi variogram, relative semi variogram, indicator semi variogram, cross semi variogram, semi madogram, covariance and correlogram.
- model the experimental variograms using the mathematical modelling functions spherical, exponential, Gaussian power, DeWijsian, linear periodic, gaussian3, exponential31and dampened hole effect.
- use conical sample search.
- define your own graph settings.
- send the variograms to a printer or a file.
- perform zonal variography.
- auto fit the experimental variogram to the variography thus giving you a good starting point for determining your search ellipsoid and orientation.
- store the auto fit parameters in a file for retrieval by grade estimation.
Semi variograms are measures of spatial variability, and as such are the key to any geostatistical study. In the geostatistical process there are usually two types of semi variograms:
- Experimental
Experimental semi variograms are calculated from the data at hand using pre-defined formulae. These variograms can be calculated in various forms, but all replace the Euclidean distancehby the structural distance2g(h). As such, the variogram distance measures the average degree of dissimilarity between a set of data values a specified distance apart. Usually the separating distance (lag) is varied in a particular direction and theg(h)calculated for each set as defined by the separating (lag) distance (note 1/2 variogram value is approximately a semi variogram). The two functions are plotted against each other in a normal graph defining the change ing(h)with varying separating distances.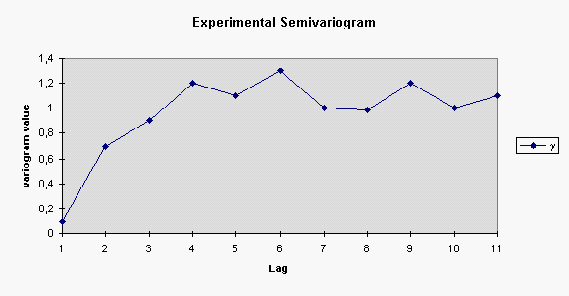
- Model
Model semi variograms attempt to define the shape of the experimental semi variogram, using pre-defined mathematical models. These variograms are smooth mathematical models used to describe best fit mathematical curves for the experimental semi variograms. These are generally described by making use of descriptors, such as nugget effect, range, sill and slope, and are commonly nested features.
Variogram Model Types
A variogram is a statistically-based, quantitative, description of the spatial correlation of sample points.
For each model the correlation function is described. Note that on variography plots, the variance function, or maximum sill - correlation is plotted.
The representations below are in a single direction; however, in practice, models are always 3D and have shapes in any direction.
The 3D shape is controlled by a rotation (bearing, plunge, dip) and three ranges (major, semi, minor).
View all model types
Nested
A nested variogram is a linear combination of several types of variograms allowing precise matching of sample behaviour. Up to 8 variograms can be nested in Vulcan.

Nugget
The nugget is the variance at an infinitely small separation distance.
This type has no spatial correlation and should be a small component of the overall variance.

Spherical
This type is the most commonly used for ore deposits. They exhibit linear behaviour at and near the origin then rise rapidly and gradually curve off.

Exponential
This type is associated with an infinite range of influence. The sill is reached at the specified range parameter. Here the range parameter is found at 1/3 of the effective range.
For backward compatibility, see the Exponential3 Model.

Gaussian
This type exhibits parabolic behaviour at the origin and, like the spherical model, rises rapidly. The Gaussian type reaches its sill smoothly, which is different from the spherical model, which reaches the sill with a definite break. The Gaussian model is rarely used in mineral deposits of any kind. It is used most often for values that exhibit high continuity.
To use this model, enter the effective range of the sill.
For backward compatibility, see the Gaussian3 Model.

Power
For this model the major axis serves as the range parameter. The semi-major and minor axis distances must be adjusted in a corresponding ratio to preserve the anisotropy.
DeWijsian
This type is a representation of a linear semi-variogram versus its logarithmic distance.

Linear
This type is a straight line with a slope angle defining the degree of continuity.
Note: that this model does not reach a sill.


Periodic
This is a sine wave with one complete period over the effective range. This model is not commonly used because it can cause samples at greater distances to have higher correlation.


Gaussian3
This is just like the Gaussian model, but 3 times the effective range must be entered. This is for compatibility with previous releases.

Exponential3
This is just like the exponential model, but three times the effective range must be entered. This is for compatibility with previous releases.


Dampened Hole Effect
Dampening is achieved by multiplying the covariance function by an exponential covariance, that acts as a dampening function.

For more information on Variography refer to Block Appendices D Geostatistical Modelling and the paper "Geological Overview: Ore Reserve Estimation in Vulcan written by Maptek Brazil - 1997.

