Operation Report
Reporting Operations on Multiple Sections and Plotting sections
Use the Operation Report option to create reports containing information about operations carried out on sections. You can choose which operations to include in the report and whether to report on the current section, all of the sections or a subset of the sections.
A report can either be created as a single file or can be created as separate report files for each chosen section. These report files contain the number of the section as part of their name, for example ENVISAGE_5.txt, where ENVISAGE is the user defined name of the report file and 5 is the section number. The report file can be generated in formatted ASCII text or CSV format. The latter allows for easy import into spreadsheet packages, providing scope for additional analysis, if required.
The operations are read from the section log file, <proj><spec_file_id>_<section_number>.rdlog.tmp. This file is created automatically and includes information on every operation that is carried out. To ensure that operations that you are no longer interested in do not get reported, use the Reset Log File option (under the Dragline > Blocks submenu) to reset the log file.
It is also possible to create a plot layer of the chosen sections and operations. You can then use any of the plotting options to produce a plot file or a hard copy of the plot layer. Refer to the File > Plot submenu for more information on plotting. It is also possible to plot non-dragline objects, such as dimension line objects, text and points. However, to plot these objects they must have been saved into a section layer.
If you want to create a report (and plot layer) on a subset of the sections, then the sections need to be displayed onscreen.
Instructions
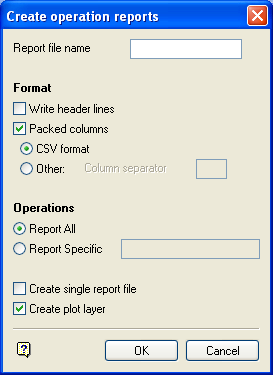
On the Dragline menu, point to Files, and then click Operation Report to display Create operation reports.
If a Dragline specifications file (.rsp) was not opened prior to selecting this option, then the Open Dragline Specification panel displays first.
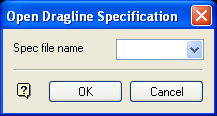
Open Dragline Specification panel
Spec file name
Enter, or select from the drop-down list, the <spec_file_id> part of the dragline specifications file name. The maximum size is 6 alphanumeric characters. Selecting a name from the drop-down list will open an existing specifications file. Entering a new name will create a new specifications file.
Click OK.
Report file name
Enter the name of the file that will be used to store the report. To create a new file, enter the file name and file extension (.txt or .csv). By default, the resulting report file will be stored in your current working directory. To store the report in another directory, enter the full path for the resulting file, c:\MyData\Report.csv.
If you enter the name of an existing report file, then you will be required to specify whether you want to overwrite the file or append the new report information.
Write header lines
Select this check box to include header information about the file and the current section.
Packed columns
Select this check box to generate packed columns that are separated by a defined character. Select the CSV format option if you want the columns in the resulting reports to be separated by a single comma (,). Use the Other option if you want the columns to be separated by a character other than a comma, for example, a pipe ( | ) or just a space.
If the Packed columns check box is not checked, then the columns in the resulting report will be properly aligned.
Operations
Report All
Select this option to report all operations carried out.
Report Specific
Select this option to report a range of specific operations by entering the section numbers separated by commas, for example, 1,2,5,6-10.
Create single report file
Select this check box if you only want to create a single report file. If this check box is not enabled, then a separate report file will be created for each section. To distinguish between the reports, the section number is added automatically to the file name, for example, ENVISAGE_5.txt where ENVISAGE is the name entered in the panel and 5 is the section number.
Create plot layer
Select this check box to create a plot layer, which can then be used to generate a plot file or a hard copy. The parameters, such as the colour and whether or not to include the operations for the plot layer, are set through theOperation Plot Layerpanel. The Operation Plot Layer panel displays after the Operation parameters to report panel has been completed.
Click OK.
The following panel is then displayed.
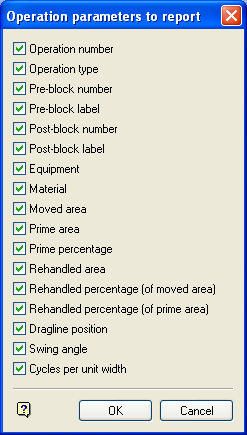
This panel allows you to select which operation parameters to report.
Operation number
This is the number indicating the order of the operations, as read from the section log file.
Operation type
This is the type of operation performed through the Move Blocks submenu.
| Operation Type | Move Blocks option |
| DRAGLINE RT | Dragline - Right Toe |
| DRAGLINE C | Dragline - Centre |
| DRAGLINE LT | Dragline - Left Toe |
| BULLDOZE L | Bulldoze - Left |
| BULLDOZE R | Bulldoze - Right |
| BALANCE | Area Balance |
| RESHAPE | Area Reshape |
| CUT&FILL | Area Cut & Fill |
| REMOVE | Remove Block |
Pre-block number
The block number of the block on which the operation was performed.
Pre-block label
The block label of the block on which the operation was performed.
Post-block number
The block number(s) of the block(s) that resulted from the operation.
Post-block label
The block label(s) of the block(s) that resulted from the operation.
Equipment
The equipment used to perform the operation.
Material
The type of material moved in the operation.
Moved area
The amount of material moved in the operation, in unswollen (bank) square units.
Prime area
The amount of Moved area that had not been moved before.
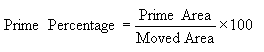
Prime percentage
Rehandled area
The amount of Moved area that is rehandled by the operation.
![]()
Rehandled percentage (of moved area)
The percentage of Moved area.
![]()
Rehandled percentage (of prime area)
The percentage of Prime area.
![]()
Dragline position
The position of the dragline during the operation, in 2D (X',Y') section coordinates. This is only reported if the equipment used is a dragline.
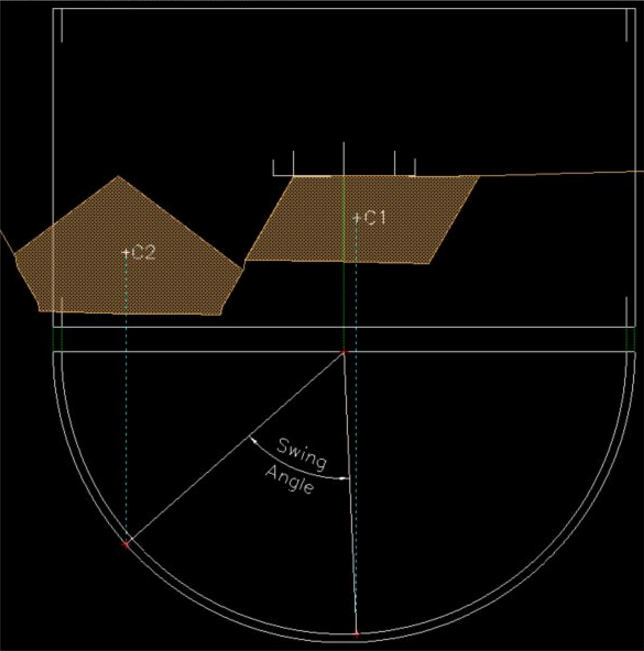
Swing angle
The average swing angle for the dragline operation, in degrees. The calculation is based on a simple, centroid to centroid assumption (see Diagram 1 below). This is only reported if the equipment used is a dragline.
1
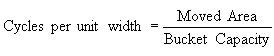
Cycles per unit width
The number of dragline swing cycles required for the dragline operation (per unit width of section). This is only reported if the equipment used is a dragline.
Click OK.
If you chose to create a plot layer, then the following panel will be displayed.
Operation Plot Layer

Layer
Name
Specify the name of the operation plot layer. The drop-down list contains the names of all layers found in the currently open design database. If you select an existing layer, then the resulting data will be appended to the nominated layer. If you enter the name of an existing layer that is not currently loaded, then you will need to confirm whether you want to load the layer or replace it, that is, overwrite its contents.
To create a new layer, enter the layer name. The layer name:
- May contain up to 40 characters
- Must begin with an alphanumeric character [0-9] or [a-z]
- Cannot include spaces
- Can include hyphens [ - ], plus signs [ + ], underscores [ _ ], periods/dots [. ]
- Can include the special characters of ÁÂÃÀÇÉÊÍÓÔÕÚÜÑ that are used in the Spanish and Portuguese languages
Description
Enter a description to further describe the contents of this layer. The description can be up to 80 alphanumeric characters and may include spaces. If a description is not entered, then a default description will be used instead. If the chosen layer already has an assigned description, the description displays when the layer is selected. Existing layer descriptions can be overwritten.
The plot layer will be in tabular format with each section appearing in a 'cell' of the table. You can specify the number of columns and the distance between the rows. It is important to select a distance greater than the largest chosen section in order that the sections do not overlap./dd>
Section Layout
Number of Columns
Enter the number of columns into which the sections will be arranged in the plot layer.
Row Spacing
Enter the distance between the rows. It is important to select a height greater than the largest chosen section in order that the sections do not overlap.
Dragline Objects
Plot Section Axes
Select this check box to plot the section axes. You will need to specify the X and Y annotation intervals.
Plot dragline extents
Select this check box to plot the dragline extents box.
Non-Dragline objects
Check the check boxes for the objects that you want included in your plot. These objects must have been saved into a section layer. If the Plot Text check box is not checked, then block labels will not be displayed in the resulting plot.
Block Display Attributes
Specify a colour, line type and the pattern of the blocks for up to 10 sequential operations. If there are more than 10 operations in your plot, then the colour map will repeat itself.

