Pivot Table Report Manager
Use this to communicate schedule information by creating a pivot style report in which you can quickly generate various tables of information.
Instructions
The first step is to create a Pivot Table Report template using the Pivot Table Manager.
On the Report tab, select Pivot Table Report Manager to display the following interface.
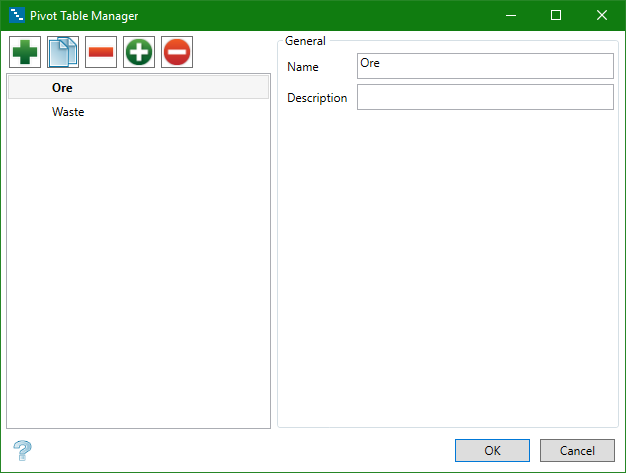
Figure 1: Pivot Table Manager
Adding, removing, and renaming a pivot table report
|
|
Click Add to add a new entry. |
|
|
Select an entry to highlight the name, then click Copy to create a copy of the selected entry or press Ctrl + C. |
|
|
Select an entry to highlight the name, then click Remove, or press Delete, to remove the selected entry. |

|
Select an entry to highlight the name, then click Set Current to set the currently highlighted table as the one viewed in the report. |

|
Select an entry to highlight the name, then click Reset Current to deactivate and reset the currently selected table. |
Renaming a pivot table report
Select an entry to highlight the name, then modify the displayed information as needed.
Click OK when finished.
All the available pivot table reports that have been created in the Pivot Table Manager panel will be displayed in the Current Pivot Table Report drop-down list. Select a table from this list to activate it.
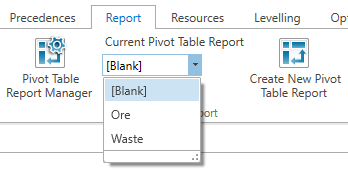
Figure 2: Current Pivot Table Report drop-down list.
If Blank is selected from the drop-down list, a new pivot table report will automatically be added to the Report Manager called Pivot Table <number>, and the icon to open the report will be titled Create New Pivot Table Report.
If an existing pivot table is selected, then the name below the icon to open the report will reflect the title of the report, as seen here.

Figure 3: Current selection in list is reflected in icon title.
Clicking on the Select Report icon will display the pivot table report in a tab next to the Activity Window.

Figure 4: Example report showing the tonnage by quarter (rows) and year (columns).
Set up the report by dragging and dropping any available attribute into the cells designated for filters, rows, columns, and results.
Available Attributes
This is a list of all the available attributes that can be used.
Note: At the bottom of the attributes list are any user periods that have been created. The user periods can be useful when you want to report on different time frames.
Tip: Double-clicking an attribute in the Available Attributes cell will automatically move it to the Results cell. Likewise, double-clicking an attribute in the Result cell will automatically move it back to the Available Attributes cell.
Results
You can add multiple attributes to the Results cell., You can also add the same attribute multiple times, selecting a different Result Type for each instance.
Any edits available for the attribute will be shown in the Result Type drop-down list.
If the attribute is a DOUBLE, you will be able to edit the number of decimal places used in the report by clicking the Decimals cell.
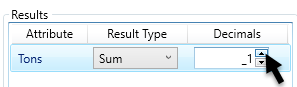
Figure 5: Set number of decimal places.
After you have set up the report, click Save the Save icon in the upper right corner of the report. This will save your table into the Undo/Redo stack for the application.
You can hide the attributes by clicking the Hide icon, giving you more room to display the report.
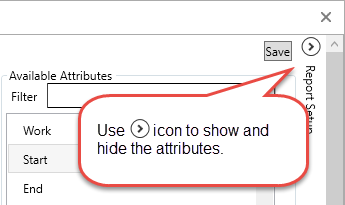
Figure 6: Collapse attribute selection column to make more room.
You can detach the tab and display the table as a separate window by clicking and dragging the tab away from the Gantt Scheduler window. This can be helpful if you need to enlarge the report window.