Database Drift Analyser - Output
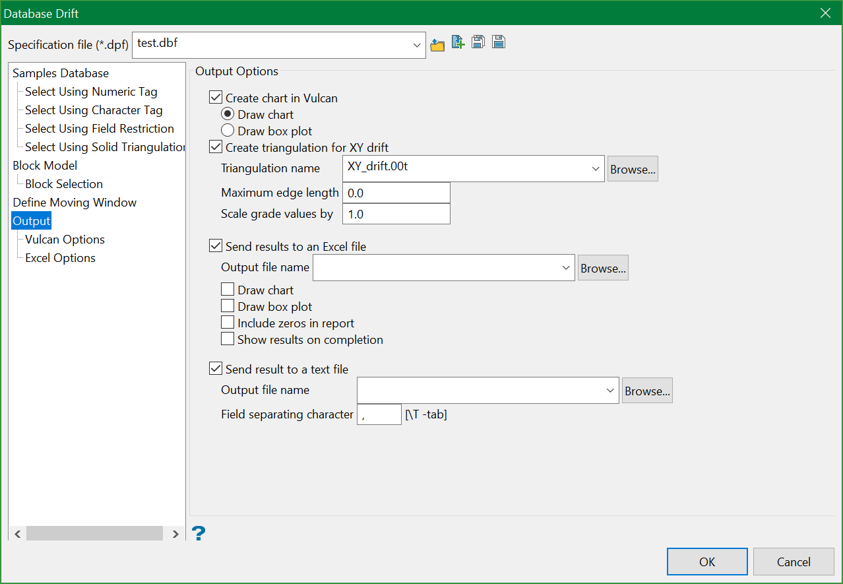
This section allows you to define where the output graphs and tables are displayed and exported. You can select Vulcan and/or Excel as the output destination for the charts. For 2D charts (surfaces), Excel can be used. Vulcan can be used for 3D triangulations displaying the drift surface.
XY drift charts in Excel (2D surface) are limited to 255 classes. This is due to the maximum number of columns that Excel allows.
Output options
Create chart in Vulcan
Select this check box to create a chart in Vulcan.
Draw chart
Select this option to draw a chart. The single average will be drawn.
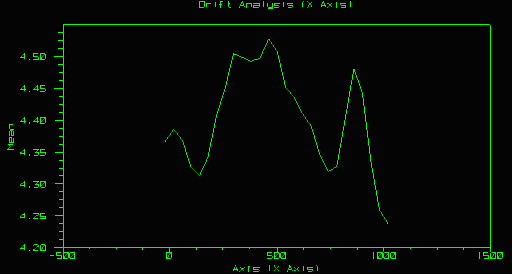
Figure 1: Chart
Draw box plot
Select this option to draw a box plot. The box plot displays a representation of the distribution of samples in each slice.
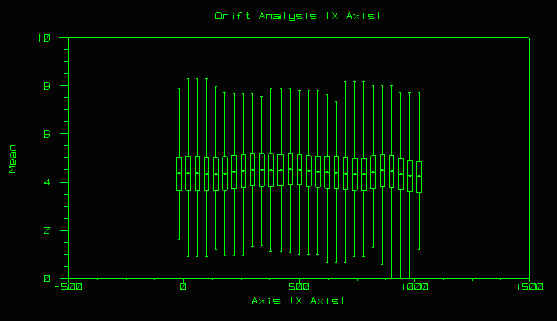
Figure 2: Box plot
Include zeros in report
By default, this tool will provide all values. However, select this option if you prefer not to use zeros in your analysis.
Create triangulation for XY drift
Select this check box to create a Vulcan triangulation containing the X and Y locations as well as the average grade values (based upon calculations). The X-Y plane check box (in the Options section) needs to be ticked in order for this option to be accessible. If the X-Y plane check box has not been ticked, then this option will be disabled, i.e. unavailable.
The list contains all triangulations in the current working directory. Click Browse to select a file from another location.
To create a new file, enter the file name and file extension.
Maximum edge length
The edge length value helps to prevent the creation of triangles between non contiguous points.
Scale grade value by
The scaling factor helps to exaggerate the grade values so that a flat triangulation will not be seen, as general grade variations can be a lot smaller that the variations between coordinates.
Send result to an Excel file
Select this check box to output the result of the calculations to an Excel file (.xls or .xlsx, depending on your version of Excel). You will need to specify the name of the file that will be used to store the resulting calculations (the default is " default.xls"). Results include X, Y, and Z charts and associated data based on local coordinates.Note The Excel output contains two fields reporting the average value. The field titled Average is the sum of the grades/number of the grades. This average is not weighted. The field titled Mean is a weighted mean of the grades, the weighting being either by mass or by volume depending on your choices in the Block Model part of the drift analyser panel.
The drop-down list contains all Excel files found in your current working directory. Click Browse to select a file from another location. To create a new file, enter the file name and file extension.
Draw chart
Select this check box to draw a chart in Excel. The single average will be drawn. An example is shown below.
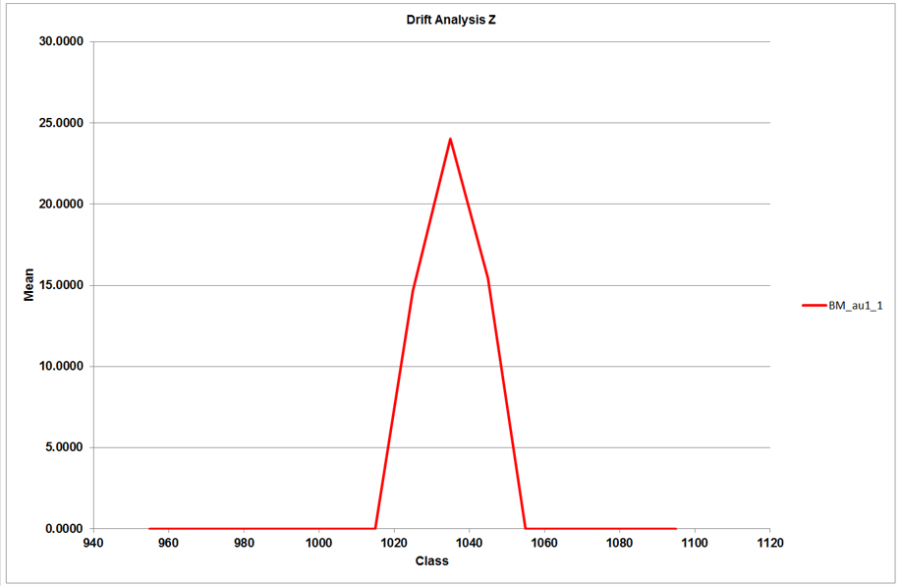
Chart example
Draw box plot
Select this check box to draw a box plot Excel. The box plot displays a representation of the distribution of samples in each slice. An example is shown below.
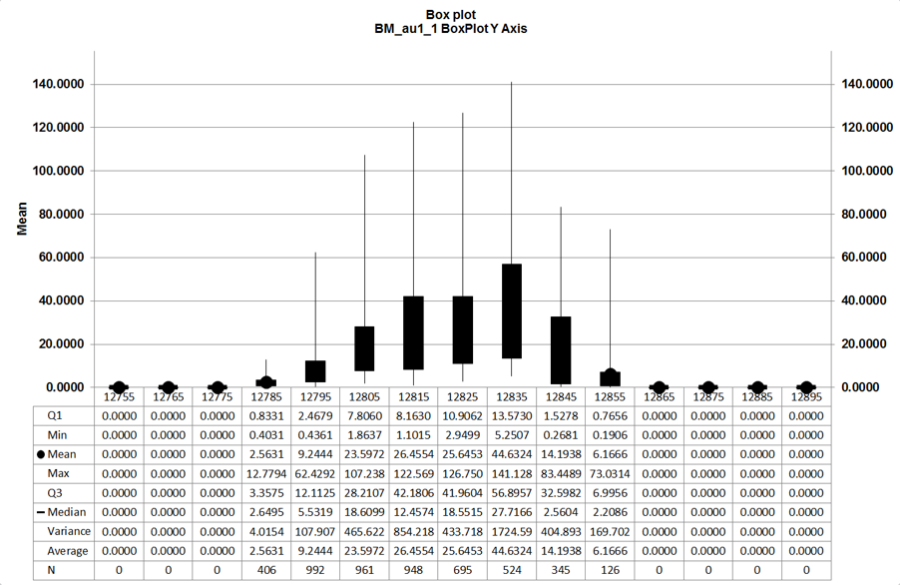
Box plot example
Show results on completion
Select this check box to view the resulting output through Microsoft Excel as soon as the file as been created.
Send result to a text file
Select this check box to store the calculation results in a nominated CSV file. You will need to specify the name of the file that will be used to store the resulting calculations (the default is " default.csv "). The drop-down list contains all .csv files found in your current working directory. Click Browse to select a file from another location.
To create a new file, enter the file name and file extension.
You can also specify a field separator for the resulting file (a single comma will be used by default).

