Domains
This topic includes information about the Domains branch of the Implicit Modelling Editor.
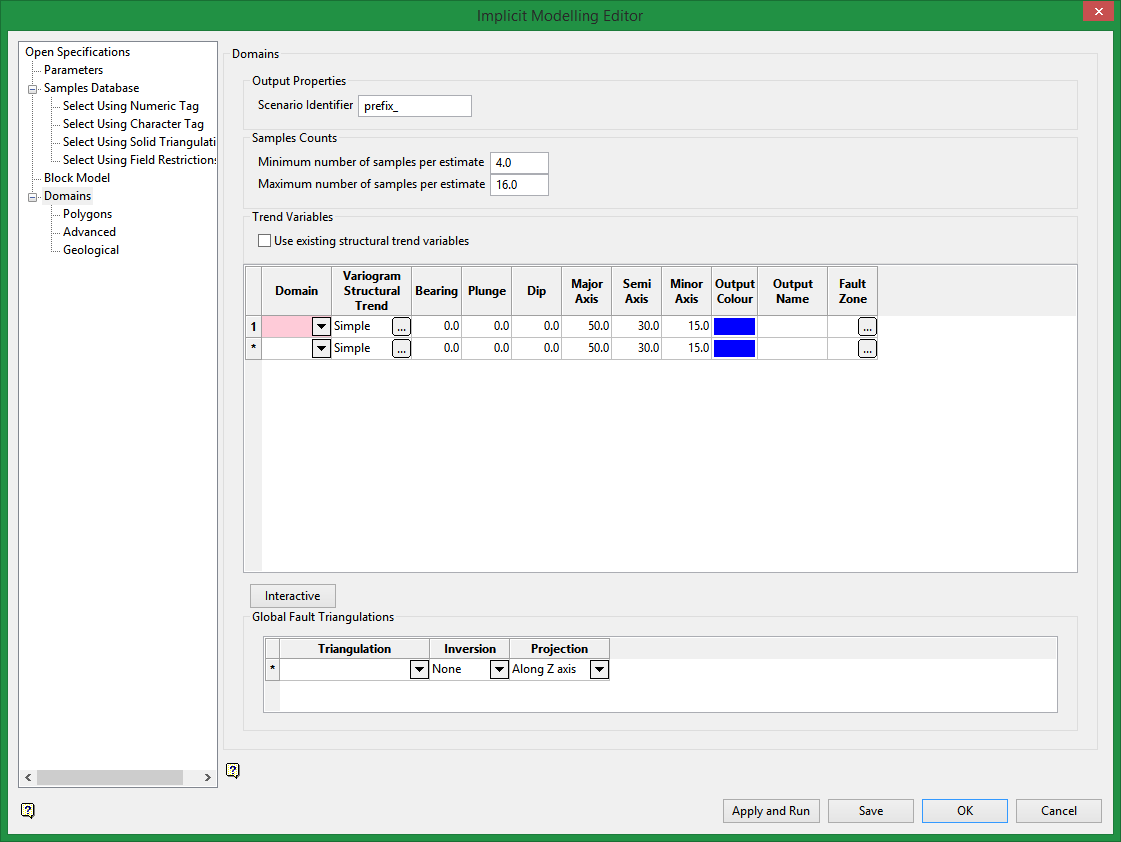
Output Properties
Scenario identifier
Enter a prefix for the names of the output files of the scenario. The prefix must begin with a letter and cannot contain special characters. This prefix will be applied to the triangulations, block model variables, and block model values.
Samples Counts
Minimum number of samples per estimate
Enter the minimum number of samples that have to be found to generate an estimate. Estimates with less than this number of samples in the search area are assigned the default grade value.
Maximum number of samples per estimate
Enter the maximum number of samples to be used in any grade estimation. If a greater number of samples are found than the specified maximum, only samples closest to the centre are used.
For example, if you specify a maximum number of samples of 10, but there are 30 samples found, only the 10 samples closest to the centre will be used in the estimate.
Trend Variables
Use existing structural trend variables
Select this check box if you want to use existing structural trend variables instead of recalculating them based on the surface selected in the Surface list on the Variogram panel. This will speed up the process because if this check box is selected, implicit modelling looks at the block model to make sure that the variables that it would have computed are already defined, and if so, proceeds as if they were already computed. Unless you have modified the values in the block model, or chosen a different surface for the structural trend, the process will achieve the same result in less time.
Rock Types and Cutoffs Domain
Rock Type/Cutoff Domain
If you selected Categorical as the Model Type on the Open Specifications branch, select a rock type from the Rock Type list. The list contains all rock types in the selected model parameters file. You can also select multiple rock codes using '*' (asterisk), ',' (comma), '?' (question mark), or '&' (ampersand) as wildcards.
Wildcards include '*' (asterisk), ',' (comma), '?' (question mark), and '&' (ampersand).
The '*' wildcard is used to match a single character.
The ',' wildcard is used to specify multiple codes in a list.
The '?' wildcard is use to match an alphanumeric character.
The '&' wildcard is used to match a range of numbers.
For a dataset including: ABC1, ABC2, ABC3, ABC12, ABC123, and ABC$
ABC* would include ABC1, ABC2, ABC3, and ABC$
ABC1, ABC2, ABC123 would include ABC1, ABC2, and ABC123
ABC? would include ABC1, ABC2, and ABC3
ABC1&3 would include ABC1, ABC2, and ABC3.
If you selected Grade as the Model Type on the Open Specifications branch, enter a cutoff for the sample interval in the Cutoff box.
Variogram Structural Trend
Click the Browse icon  in the Variogram Structural Trend column to display the Variogram panel. After you complete the variogram information on the Variogram panel, click OK to return to the Implicit Modelling Editor panel and proceed.
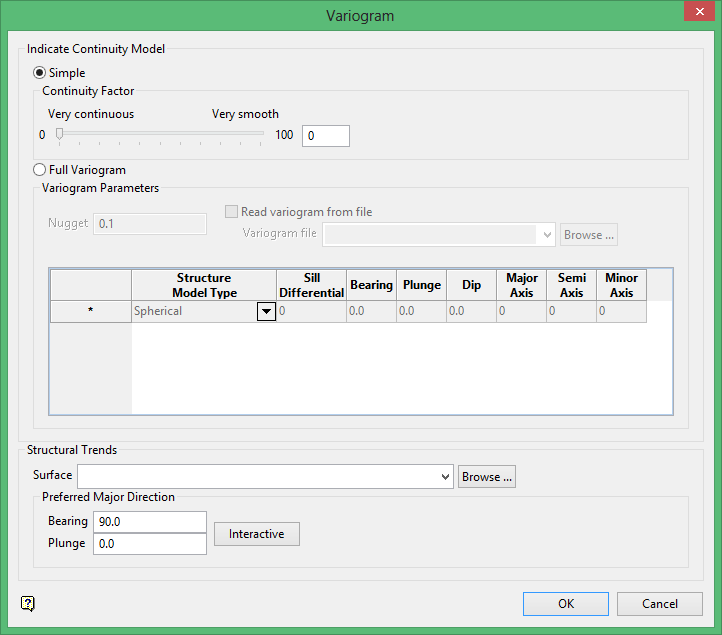
Indicate Continuity Model
Select Simple or Full Variogram to indicate the continuity model to use.
Simple
If you select the Simple option, click and drag the slider bar in the Continuity Factor section to adjust the level of continuity between Very smooth and Very continuous or enter a number between 1 (very continuous) and 100 (very smooth) in the box to the right of the slider bar.
Full
If you select the Full Variogram option, complete the following information in the Variogram Parameters section.
Variogram Parameters
Nugget
Enter the nugget. This represents the random variability and is the value of the variogram at distance (h) ~ 0.
Read variogram from file
Select this check box if you want to populate the variogram parameters from an existing variogram parameters file (.vrg). If you select this check box, select the file you want to use from the Variogram file list, or click Browse to select a file from a location other than your working directory.
Structural Model Type
Select the model type from list. (See Variogram Model Types for more information.)
Sill Differential
Enter the difference between the value of the variogram where it levels off and the nugget. For example, if you have a total sill of 1.0, and a nugget of 0.15, the sill differential should be 0.85 = (1.0 - 0.15).
Structural Trends
Surface
Select the surface triangulation from the list, or click Browse to select a file from a location other than your working directory.
Preferred Major Direction
Enter values for the preferred major direction for bearing and plunge in the Bearing and Plunge boxes, or click Interactive to set the bearing and plunge interactively.
Interactive
If you click Interactive, you will be prompted to select an origin point and an object on the screen. To exit without selecting an origin point or object, right-click to return to the Variogram panel.
Click OK to save changes and return to the Implicit Modelling Editor panel.
Output Colour
Click on the cell in the Output Colour column to modify the triangulation colour and select the desired colour on the Colours panel that displays. To specify a colour range for multiple triangulations, right-click on the Output Colour header column and select Colour Range.
Output Name
If you want the output triangulation to have a different name than the original triangulation, enter the new name in the box.
Special characters are not allowed in an output triangulation name. \ / : * ? - $ % # & " < > |
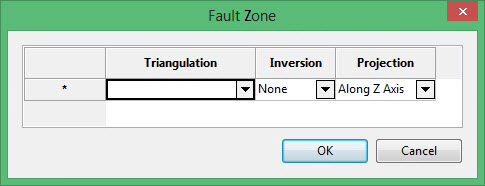
Fault Zone
If you want to use the same variogram information for a given rock type (zone), use the Global fault triangulations grid at the bottom of the panel. If you want different variogram for different cases, use this table and create a separate row for each case.
Use this grid if you want to specify other information in the grid differently on different fault regions.
If you have a domain A and a fault solid fault.00t, and you want different variogram inside fault.00t and outside fault.00t, you need to have two rows in the panel: one which has domain A with 'inside fault.00t' indicated in the fault zone column, and with the variogram information, output name and output colour specified for inside fault.00t; and then a second row with domain A, the variogram information you want for outside of fault.00t, and 'outside fault.00t' indicated in the fault zone column. The 'inside' or 'outside' option is available when you click on the fault zone column.
If a scenario is covered in more than one row, the first row takes precedence over the second row.
If you have a row for 'zone A, inside fault1.00t', then a row for 'zone A, inside fault2.00t' and then a third row for 'zone A, outside of fault1 and outside of fault2', and if fault1 and fault2 overlap, then that intersection between the two will be modelled using the information on the row for 'inside fault1'.
Click the Browse icon in the Fault Zone column to display the Fault Zone panel.
Use this section to create cells and set the values of the classification variables.
The rock type variables, based on triangulations. Each triangulation is defined as an inclusive/exclusive boundary or 'interface' for the previously entered variables. Boundaries define whether a variable value occurs inside or outside, above or below nominated triangulations. The maximum number of boundaries that can be defined in this option is 500. Additional boundaries can be specified by manually editing the .bdf file.
Sub-blocking is performed along these defined boundaries and is calculated to achieve maximum resolution using the minimum sub-blocking size nominated. Wherever possible, sub-blocks are coalesced into larger blocks related to the maximum size of the parent block.
When setting up the definition of a block model you need to state what boundaries you are going to use and what fields will have values assigned when he cells are created. Each boundary is represented by a triangulation. Either 2D surface triangulations or 3D solid triangulations may be used to define the geometry of a deposit.
After you specify these portions of the model, the function models them independently from each other.
If you have one solid A containing another solid B, then the inside of B, the part of A outside of B, and the part outside of A are each modelled independently. If they have two overlapping solids, then the part inside both A and B, the part inside A but outside of B, the part inside of B but outside of A, and the part outside of A and also outside of B are each modelled independently. In general, all of the combinations of inside and outside are modelled separately.
Triangulation
Select a triangulation. The list contains all triangulations in the current working directory. Click Browse to select a file from another location. You can also select selection files (.sel) or Version 3.x selection files (.sms) from the Browse dialog.
If a triangulation is not closed, you may need to set the inversion and projection columns also.
Inversion
Specify the desired level of inversion. Select None (no) inversion, Partial inversion, or Complete inversion. Partial inversion has not effect for 3D triangulations.
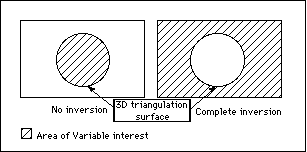
Figure 1: 3D Triangulation Inversions
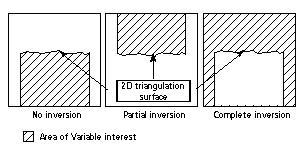
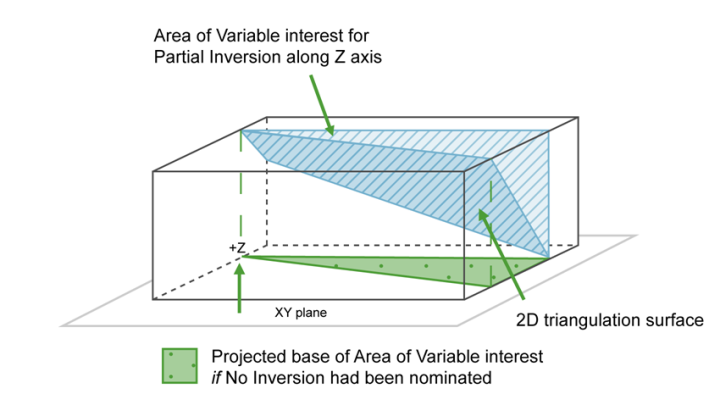
Figure 2: 2D Triangulation Inversions
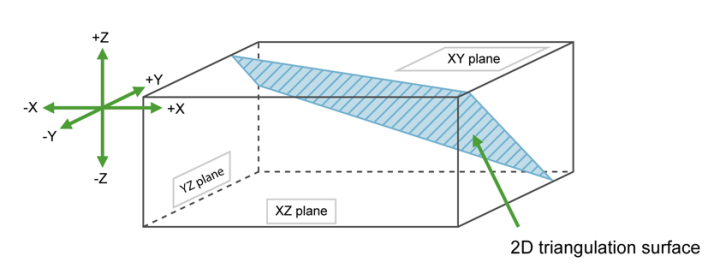
Projection
Select the projection axis. The projection axis defines the direction for a surface and has no effect when working with solids. This option is used in situations where steeply dipping structures define regions.
If No inversion is selected, the negative side of the triangulation is the area of interest. If Partial or Complete inversion is selected, then the positive side of the triangulation is the area of interest.
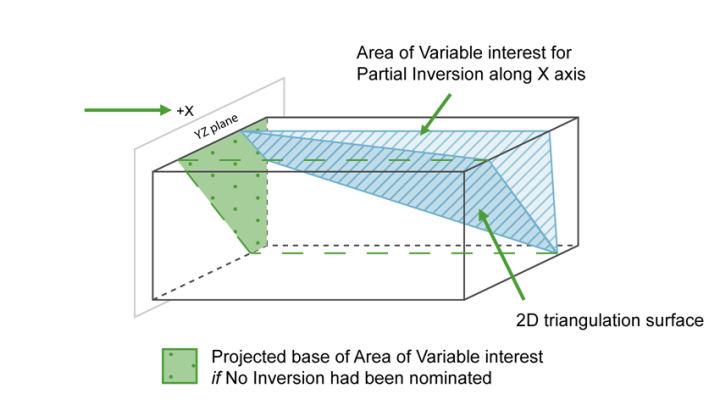
For triangulations (ore bodies) that are steeply dipping, it may be necessary to project along the X or Y axis to ensure the correct inversion is applies.
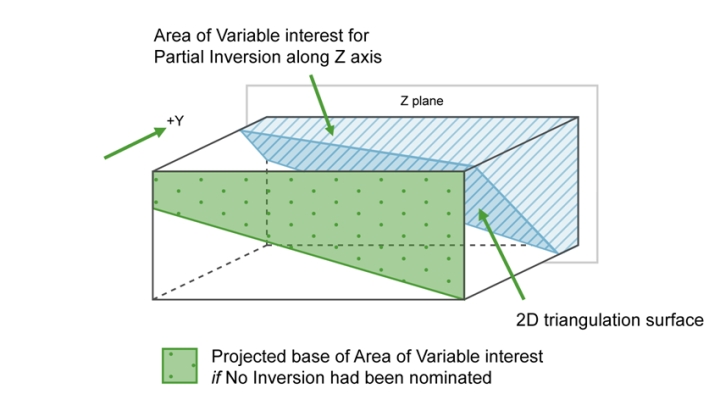
For triangulation (ore bodies) that are near to horizontal (lying in the XY plane), you would project along Z axis. The area of interest is then below the triangulation (if None (no inversion) is selected) or above (if Partial Complete is selected).
Click OK to save changes and return to the Implicit Modelling Editor panel.
Interactive
If you want to interactively set the ellipsoid parameters, select a domain row in the grid, then click the Interactive button, or right-click on a row and click Interactive on the context menu that displays. Then click a point in the Vulcan window to indicate the centre of the ellipsoid. The Edit Ellipsoid panel displays and a preview of the ellipsoid displays in the Vulcan window. The colour of the ellipsoid is based on the colours specified in the Vulcan colour palette.
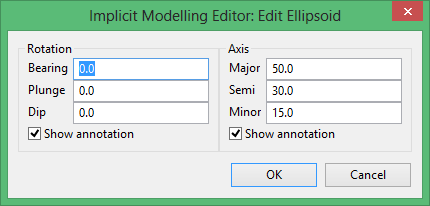
On the Edit Ellipsoid panel, you can modify the bearing, plunge, and dip as well as the major, semi, and minor axes while previewing the changes in the Vulcan window. You can also click and drag the lines around the ellipsoid in the Vulcan window to modify the bearing, plunge, and dip, and the changes will automatically be displayed on the Edit Ellipsoid panel. Select or clear the Show annotation check box to show or hide the annotation in the Vulcan window.
To change the position of the ellipsoid, press and hold the centre button on your mouse while moving the cursor in the Vulcan window.
Global Fault Triangulations
If you want to use the same variogram information for a given rock type (zone), use this table. If you want different variograms for different cases, use the Fault Zone table above.

