Triangulate
Use the Triangulate option to model structural surfaces by triangulation. The triangulation process creates triangular facets between the data samples. The triangles chosen are optimal, that is, they have the best possible angles. No vertex is sharper than necessary.
This option will triangulate the data points and convert the triangulation to a grid model.
Instructions
On the Grid Calc menu, point to Model, and then click Triangulate to display the Triangulate panel.

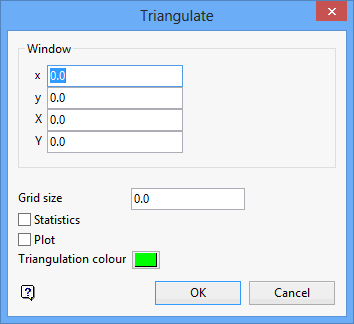
Window
Enter values for the minimum (x, y) and maximum (X, Y) Eastings and Northings. These values will define the four corners of the grid.
Grid size
Enter the size of the grid cell. Although, there are no software limits on the number of cells in the grid, obviously speed of operation may suffer when using a large number of cells.
Statistics
Select this check box to display, in the Grid Calc report window, statistics on the newly created triangulation. The statistics comprise of minimum and maximum vales, z range, z mean, number of active (non-masked) points, active area and total triangulation area.
Plot
Select this check box to display the triangulation on the screen.
Triangulation Colour
Select the colour for the triangulation
Click OK.
The currently loaded data points are then triangulated.

