To Grid Mesh
Convert a Triangulation to a Grid Mesh
Use the To Grid Mesh option to construct a grid mesh model from a triangulation. The grid may extend beyond the triangulation extent; the extrapolated data is found using the same method as the Extrapolate option.
This option only works in Plan view.
The grid name does not display the full path to the chosen triangulation from which it was made, unless it is not the current working directory. The name will have the project code added if it was missing (necessary so that the grid can be used by GDCALC).
The extension.00t on the triangulation will be changed to .trg on the grid by default, so that the grid can be used by GDCALC (00 is treated as a numeric literal in the GDCALC parser).
Missing extensions, or extensions of more than three characters (or less than two) will have .trg added to the file.
Extension of two chars will have a G added.
All other .xxt extensions will become .xxg as before.
Any uppercase letters in the triangulation name will be converted to lowercase in the grid name (to be compatible with GDCALC) on the Vulcan Explorer.
The panel display name will still be uppercase (to be compatible with other menu items of the same type - for example showing as upper but stored as lower - these need to be changed as one project, not piecemeal).
Instructions
On the Model menu, point to Triangle Edit, and then click To Grid Mesh option
Select the triangulation. The following panel is then displayed.
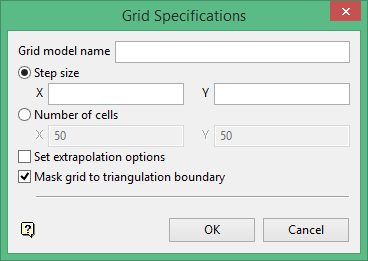
Grid model name
Enter the name (identifier) and model variable of the grid. The default is the identifier and model variable of the triangulation. The full name of a grid mesh model will be <proj><gfi>.<mv>g where <proj> = project; <gfi> = grid file identifier; MV = model variable and g indicates that this is a grid.
The grid size can be specified by entering a step size (interval) along the X and Y-axis, or by entering the number of cells (intervals) along the X and Y-axis.
Set Extrapolation options
Select this check box to view or change the extrapolation parameters.
Mask grid to triangulation boundary
Select this check box to use the triangulation boundary to mask the grid. If this check box is not checked, then the entire grid region will be visible.
Click OK.
If you chose to set the extrapolation options, then the Grid Extrapolations options panel displays.
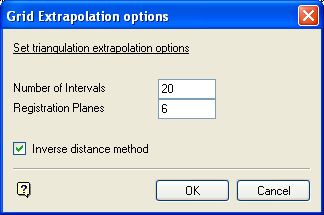
Grid Extrapolation options panel
Number of Intervals
Enter the number of vertices to place along each edge of the extrapolation rectangle. This rectangle is digitised once this panel is completed. Increase this number for a more detailed extrapolation.
Registration Planes
Enter the number of triangles to use to calculate the Z value of the extrapolated points. It should be set according to the amount of data in the surface. For a better extrapolation use a larger number.
Do not use a large number of registration planes for surfaces with few boundary triangles.
Inverse distance method
Select this check box to use an inverse distance weighted average to calculate the Z values of the extrapolated vertices. This slows down the calculation slightly, but gives a better result in most cases. If this check box is not checked, then the average of the registered values will be used. By using inverse distances, triangles further from the extrapolated vertex have less influence on the Z value than closer triangles.
Select OK.
Indicate the origin point of the model. Once indicated, you will then be asked to indicate the model extent. To do this, digitise a rubber band box around the triangulation extents.
The following panel is then displayed.
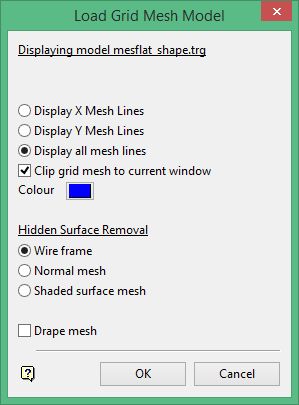
Display triangles
Select this check box if you want to display the triangulation (if it still exists) that was used to generate the grid model.
Display Mesh Lines
Select whether to display the X mesh lines, the Y mesh lines or all mesh lines.
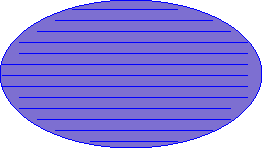
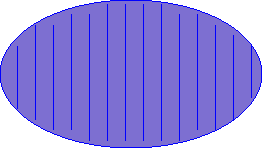
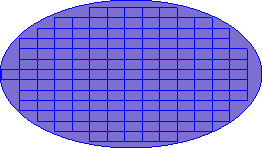
Figure 1: Display X lines, Y lines, or all mesh lines.
Clip grid mesh to current window
Select this check box if you only want to load the area of the model that falls within the current zoom window, i.e. you can zoom up to the required area before loading the model. If unticked, then the entire model will be loaded.
Colour
Select a colour for the grid.
Hidden Surface Removal
Select one of the following display options:
Wire frame
Wire frames are transparent, i.e. they allow you to see underlying models. In the diagram below the mesh is on top of the blue data, but it is still possible to see the data.
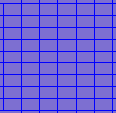
Figure 2: Wireframe grid mesh
Normal mesh Normal mesh models are not transparent. In the diagram below you cannot see data underneath the grid mesh.
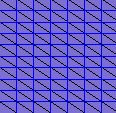
Figure 3: Normal mesh
Shaded surface mesh
The model is loaded as a solid shaded surface, i.e. not transparent and no mesh lines. Solid shading requires additional memory.
Use the ![]() 3D/Solid Shading icon on the Graphics toolbar to turn the shading on/off once the triangulation has been loaded.
3D/Solid Shading icon on the Graphics toolbar to turn the shading on/off once the triangulation has been loaded.

Figure 4: Solid shaded model
Drape mesh
Select this check box if you want to drape another grid onto the one being loaded. Draping allows the graphical display to be presented such that the spatial position, i.e. the elevation of the loaded grid, is honoured.
The grid cells are colour coded using the elevation or grid value of a second grid. For example, coal ash values can be shown on a coal structure grid.
Click OK.
The chosen grid mesh model is then displayed. If you chose to drape another grid, then the Drape panel displays first.

