Performance by Phase-Bench
Use this option to calculate the average width and length according to a flagged phase variable in a nominated block model. This option is useful when wanting to assign performance according to geometric constraints.
The results generated through this option can be outputted to a nominated CSV file and/or a Microsoft Excel spreadsheet.
Instructions
On the Open Pit menu, point to Open Cut Design, then click Performance by Phase-Bench.
Follow these steps:
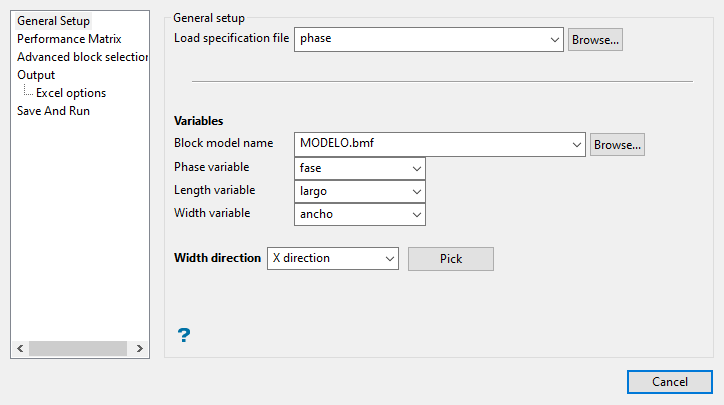
General Setup
-
Enter the name of the specification file that you want to open into Load specification file. The drop-down list contains all of the (
.ppbf) files found in your current working directory. Click Browse to select a file from another location.To create a new file, enter the file name.
-
Select the block model that you want to use. The drop-down list contains all block models found within the current working directory. Click Browse to select a file from another location.
-
Select the name of the variable that will be used to store the phase, length , and width variables.
The drop-down lists contain the names of all the variables that were assigned to the chosen block model.
-
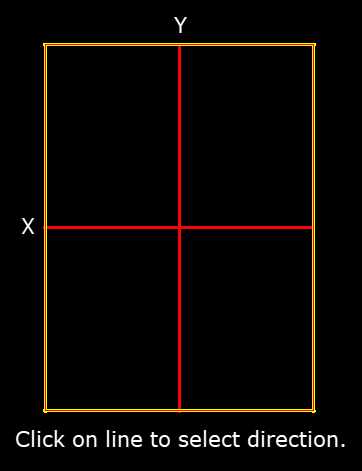
Select the Width direction (X or Y) in which to calculate the average length and width.
Click the Pick button to indicate the direction onscreen. Be sure the block model is already loaded into Envisage before using this option. The block model border display will change to resemble what is shown below, with the X and Y axes displayed as red lines. Click on a line to select the direction.
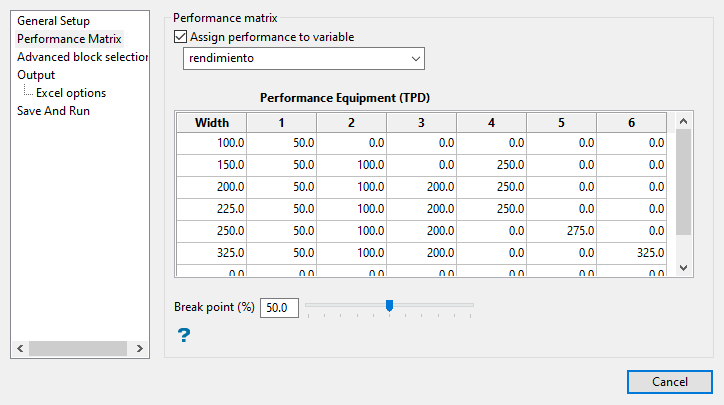
Performance Matrix
-
Click the Assign performance to variable check box to store the performance average in a nominated block model variable. The name of the block model variable can either be manually entered or selected from the drop-down list.
-
Use the Performance Equipment table to generate a matrix with geometric constraints.
-
Select the Break point percentage is used to determine the break point between two indicated widths. The break point percentage can either be manually entered or specified through using the available slide bar.
If one bench has a width value of '
180', and the break point is '50', then Vulcan will assign a value of 210 to the nominated performance variable.
Advanced block selection
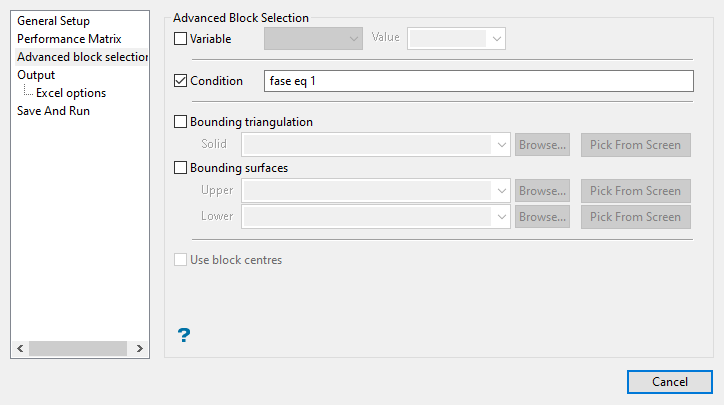
Use the Advanced Block Selection options to limit the blocks used in the calculations. These are all optional and are not required.
Select this check box to restrict the blocks by a nominated block model variable. You will need to specify the variable, as well as a particular value.
To restrict blocks to those where Material equals Ore, select 'Material' as the variable (from the drop-down list) and enter 'Ore' as the value.
Select this check box to use a further constraint upon a numeric block model variable.
'Fe GT 10.0' (iron value greater than 10.0).
The maximum size of the condition is 132 alphanumeric characters. A list of available operators/functions is provided in Appendix B of the Vulcan Core documentation.
Select this check box to restrict the blocks by a nominated triangulation. This is useful when, for example, you want to evaluate reserves in a particular solid triangulation such as a stope.
The triangulation can either be selected from the screen, from the drop-down list or through browsing your data directories. The drop-down list displays all supported triangulations files found in the current working directory.
Note: This option is not applicable to open or 2D triangulations.
Select this check box to restrict the blocks by bounding surfaces. The necessary surfaces (both upper and lower) can either be selected from the screen, from the drop-down lists or through browsing your data directories. The drop-down lists displays all supported triangulations files found in your current working directory.
Note: Only blocks that lie in the overlapping sections of the surfaces (as viewed in Plan view) will be selected.
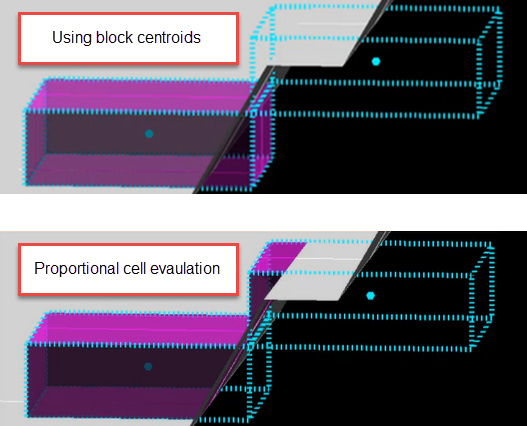
Select this check box to use the full cell evaluation method. If this check box is not selected, then the proportional cell evaluation method will be used instead.
- Full cell evaluation: Include blocks if the block centroid is in the region. The entire block will be included.
- Proportional cell evaluation: Include those blocks that touch the region, and evaluate reserves according to the proportion of the block's volume that lies in the region. Proportional cell evaluation calculates and reports the exact proportion of a block in a solid triangulation. When selecting blocks, all blocks that touch the region are selected.
Output
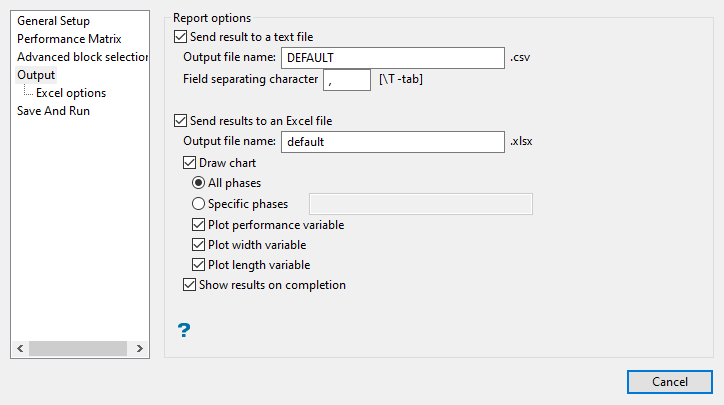
Set up how you want to view the results by editing the Report options.
Select this option to output the results to a nominated CSV file (the default file is 'default.csv').
Selecting an existing file will prompt you to confirm that you want to overwrite the file's original contents. To create a new file, enter the file name and file extension. By default, the resulting file will be stored in your current working directory.
By default, a single comma (,) will be used to separate the values in the resulting CSV file. To create a tab-delimited file, enter '\T'.
Select this option to output the results to a nominated Excel spreadsheet (.xlsx). The default output file is 'default.xls'.
Selecting an existing file will prompt you to confirm that you want to overwrite the file's original contents.. To create a new Excel spreadsheet, enter the file name and file extension. The resulting file will be stored in your current working directory.
Note: If you are outputting the results to an existing Excel spreadsheet, please ensure that the chosen spreadsheet is not open and that the Excel application is not running.
The following options are available when outputting the results to an Excel spreadsheet.
Select this check box to plot the information as a graph in the resulting Excel spreadsheet. The graph can be plotted through using all available phases or just a specific selection.
Select this check box to plot the performance variable in the resulting Excel spreadsheet. The performance variable is defined through the General Setup section of the Performance by phase-bench interface.
Select this check box to plot the width variable in the resulting Excel spreadsheet. The width variable is defined through the General Setup section of the Performance by phase-bench interface.
Select this check box to plot the length variable in the resulting Excel spreadsheet. The length variable is defined through the General Setup section of the Performance by phase-bench interface.
Check the Show results on completion check box to display the results upon completion.
Excel options
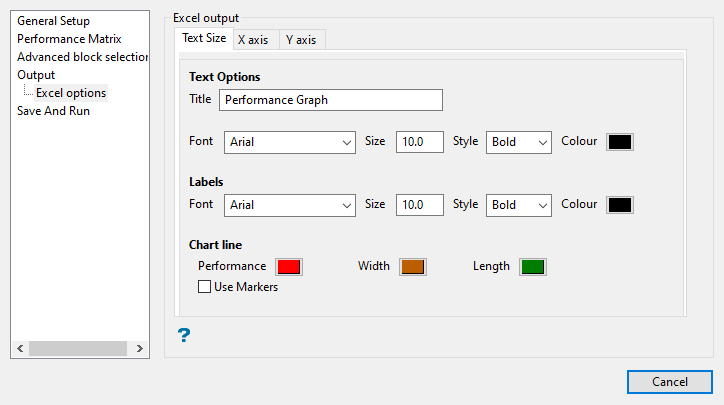
This pane lets you format the text and chart produced in Excel.
Text Options
This section to specify a title for the resulting Excel chart, as well as configure the font settings for the title text, that is, the font type, font size, font style (normal, bold, italics, or bold italics) and font colour.
Labels
This section to configure the font settings for the graph label text, that is, the font type, font size, font style and font colour.
Chart line
Select a colour for the available chart lines (performance, width and length).
Use markers
Select this check box to use markers to highlight points in the resulting graph. The marker style, that is, the marker shape and colour, are defined through the Excel application.

Figure 1: Use Markers check box enabled
Figure 2: Use Markers check box disabled
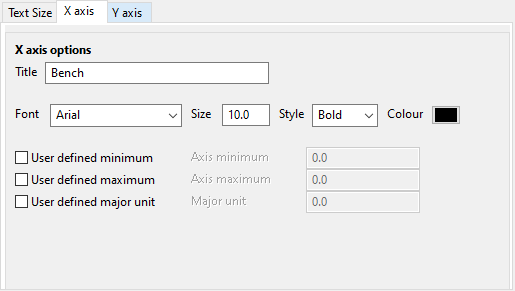
X axis options
This section to specify a title for X-axis in the resulting Excel chart, as well as configure the font settings for the axis title text, that is, the font type, font size, font style (normal, bold, italics or bold italics) and font colour.
User defined minimum/maximum
This section to manually define the range of the axis. If these fields are left blank, then Vulcan will find the minimum and maximum from the data.
User defined major unit
The documentation for this option is currently being written.
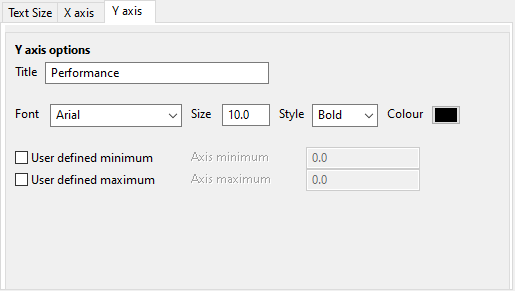
Y axis options
Use this section to specify a title for Y-axis in the resulting Excel chart, as well as configure the font settings for the axis title text, that is, the font type, font size, font style (normal, bold, italics, or bold italics) and font colour.
User defined minimum/maximum
Use this section to manually define the range of the axis. If these fields are left blank, then Vulcan will find the minimum and maximum from the data.
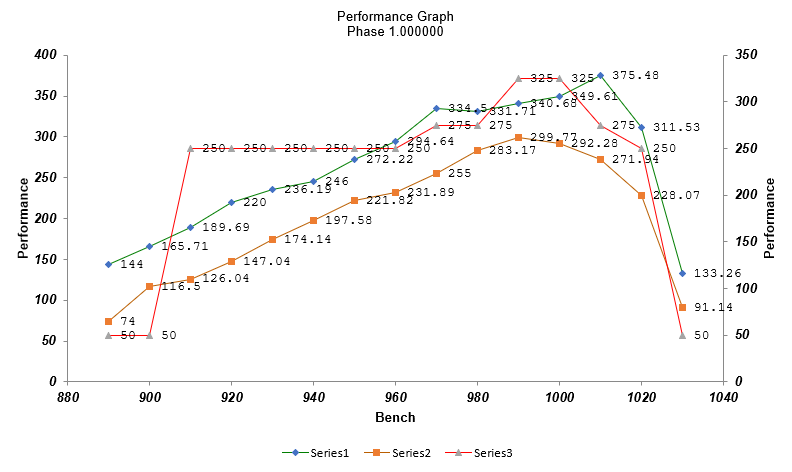
Figure 3: Example graph
Save And Run
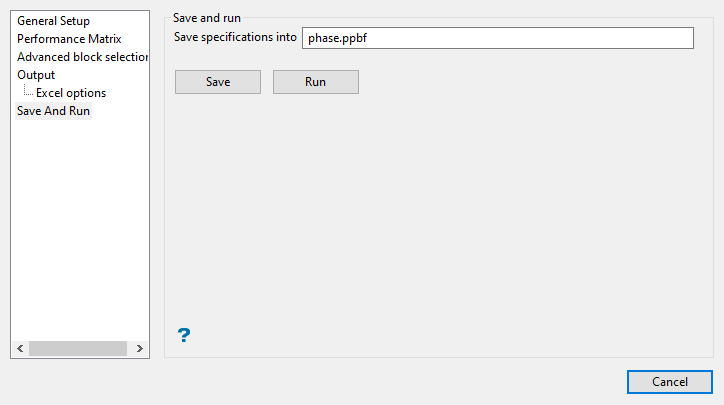
-
Enter a name into Save specifications into to save the input parameters of the panel. By default, the name of the currently open specification file (
.ppbf) displays.To save any edits made to an existing specification, just enter a new file name and save. The file name, including the file extension, can be up to 256 alphanumeric characters in length.
If you edit an existing specification file and save the edits without renaming the file, then the values will be overwritten with the new parameters.
Tip: Leave the Save specifications into field blank if you don't want to save the settings defined in the Performance by phase-bench interface.
-
Click the Save option to save the specifications in the nominated specification file.
Click the Run option to run the specified parameters.
Note: Selecting the Run option will also save the specification to the specification file.

