Explorer Visibility Pane
Filtering Chart Data
Use this to filter the data that is displayed in the Chart Explorer Pane.
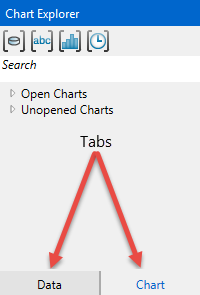
Displaying data in the Chart Explorer panel
At the bottom of the Chart Explorer panel select the Chart tab.
The Explorer Visibility pane displays any available data in your current project into four categories: Filters, Transformations, Weights, and Data Sources. Each of these categories are divided into further categories (see below).
Filters, Transformations, and Weights
As data modifiers are generated, they are stored in the project folder and made available by accessing them from the data tree. If the project is saved before closing all modifiers will be available the next time the project is opened.
Data Source
When data is imported into VDA by using the Open Data Source icon on the Data ribbon, it is displayed in the Explorer Visibility pane. Expanding the data tree for a data source will reveal the Domain and Variable branches.
Domain
VDA will automatically list any domains found in the dataset. The search criteria used to identify a domain looks for character fields with a value that appears more than once. A list of drill hole collars would not be identified as a domain field, for example, because each entry would be unique. However, a field containing various rock types might since the list of rock types would be limited to ten or so and would be repeated in numerous entries.
Variable
All the variables from a database or block model will be listed under the Variable branch of the data tree. When a variable in the Explorer Visibility pane has been selected, it will appear in the Chart Explorer pane.
Examples of filtering data:
In the examples below, the selections have been made from the Explorer Visibility pane with the results showing in the Chart Explorer pane.
Note: The chart must exist already exist prior to being selected from the data tree before a name will display in the Chart Explorer pane. The Explorer Visibility Chart Filter only displays a list of chart names that already exist. It does not create them.
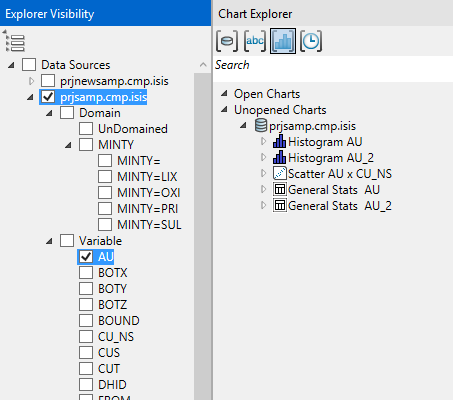
Ex. 1

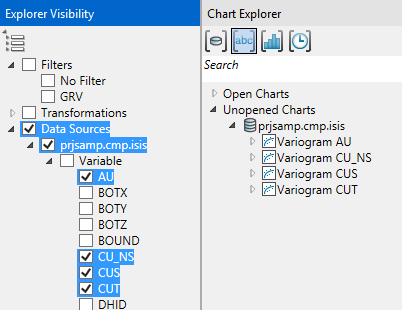
Ex. 2
Ex. 3 - Note that since no charts have been generated based on domains, nothing shows up in the Chart Explorer pane.

