Fan Variograms
Fan variograms allow you to calculate the continuity along the principle direction as well as incremental directions, all rotating around a single origin. Each increment produces a separate variogram. You determine the number of variograms. This tool is particularly helpful when the principle direction of continuity is not readily observable.
If you already have a fan variogram, proceed to Editing and Modelling a Fan Variogram for more options.
Follow these steps:
Creating a new fan variogram
-
Select your dataset. On the ribbon, go to the Data tab, then click Open Data Source. Select the dataset you want to analyse to load it into the Explorer Visibility column.
-
Select your variable using the list of variables shown in the Data Explorer.
-
Choose the type of analysis to run. On the Variography tab, in the Charts group, click Fan Variogram.
-
Click the green check
 icon to create the experimental variogram.
 -
Set the parameters for your variogram using the options found in the Properties column.
Note: You can set the parameters for your variogram before or after creating the variogram.
Fan Settings
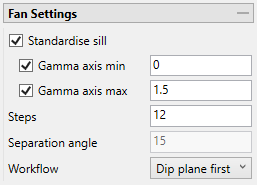
Standardise Sill - Select this check box if you want to standardise the variogram sill by dividing the results by the sample variance. This is useful when calculating a semivariogram because instead of reaching the sill at the sample variance it will reach it at 1.
Gamma axis min / max (Optional) - Select one or both of these options if you want to set the minimum or maximum extents of the gamma axis.
Steps - Enter the total number of variograms to be computed between the two (primary and secondary) fans. Each fan will consist of half this number of variograms evenly spaced in a 180 degree range.
Separation angle - The angular separation of variograms within each fan diagram.
Workflow - Select between Major direction first or Dip Plane first.
-
Select Major Direction First from the Workflow drop-down list.
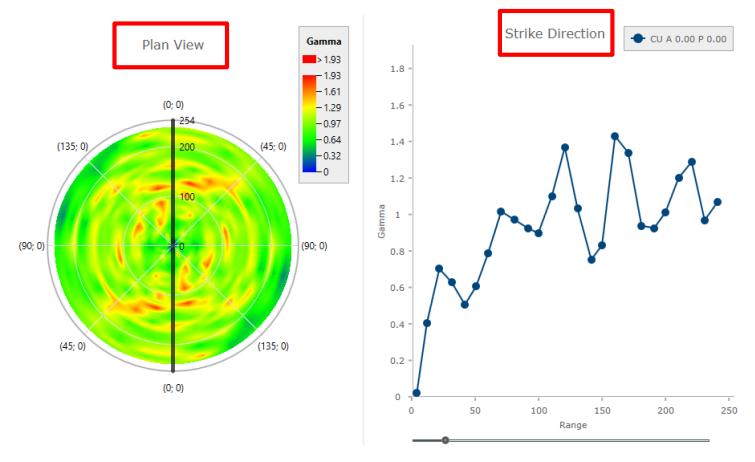
When creating a new Fan Variogram, only the major direction will be visible in the chart.
Note: The Azimuth and Plunge angles are only for the inclination of the initial plane.
-
Once created. the Fan Variogram can help you find a major direction. By moving the fan direction or selecting the direction from the grid, you can evaluate which direction seems most appropriate.
NoteBesides using the fan, you can also select the desired direction from the variogram Grid. To display the Variogram Grid, enable the Variogram Grid toggle icon in the toolbar below the charts.
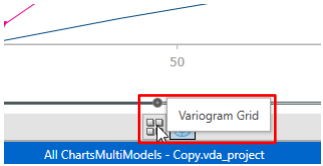
Selecting from the grid allows multiple selections by using Shift or Ctrl while clicking elements.
Ctrl allows adding or removing one element from the selection.
Shift allows for group selection, selecting all elements between the first selected item and the last selected.
-
Click the Next Fan icon after you have selected the best direction for the fan. This will generate a new plane perpendicular to the fan that includes the selected direction.
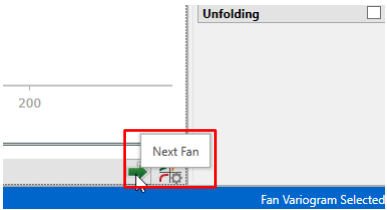
The new plane allows you to keep the best major direction. The process of generating new planes can be done as many times as you need.
If you want to go back to the previous plane, it can be done by clicking the Previous Fan icon.
-
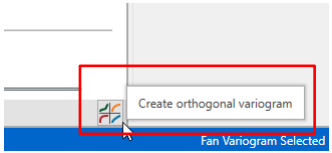
Once you select a Major direction, click the Configure Orthogonal Variogram icon to generate a new plane orthogonal to the Major direction. This will allow you to search for the Semi and Minor directions.
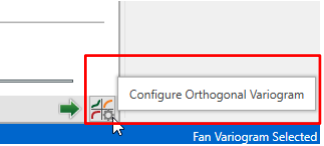
Note: Clicking on the Previous Fan icon while searching for the Semi and Minor directions will take you back to searching for the Major direction in the last fan.
-
Click the Create Orthogonal Variogram icon to create an Orthogonal Variogram Chart with the same data as specified in the Fan Variogram.
Using Dip Direction First allows you to create the orthogonal variogram by only using 3 fans: Plan view, Vertical view, and Dip plane. Use these to select the strike and dip inclination of your orthogonal variogram.
-
Select Dip Direction First from the Workflow drop-down list.
-
Select the strike direction by moving the fan axis with your mouse, or selecting the direction from the grid. This will be the direction in which the final fan will be tilted.
-
Click the Next Fan icon after you have selected the best strike direction for the fan. This will generate a new fan that includes the selected direction. Vertical view will display a completely vertical fan, orthogonal to the selected strike direction.
The process of generating new planes can be done as many times as you need.
If you want to go back to the previous plane, it can be done by clicking the Previous Fan icon.
-
Click the Next Fan icon after you have selected the best vertical direction for the fan. This will create the Dip Plane, which will be the last fan where the major and semi directions will be located. It contains the strike and the dip plane directions selected in the previous steps.
-
Select the dip direction, which is the direction that defines how tilted the final fan will be. It also implicitly defines the minor direction, since it will be the direction perpendicular to the last fan.
-
Select the major and semi directions.
-
Click the Create Orthogonal Variogram icon to create an Orthogonal Variogram Chart with the same data as specified in the Fan Variogram.
NoteAs noted above, besides using the fan you can also select the desired direction from the variogram Grid. To display the Variogram Grid, enable the Variogram Grid toggle icon in the toolbar below the charts.
Selecting from the grid allows multiple selections by using Shift or Ctrl while clicking elements.
Ctrl allows adding or removing one element from the selection.
Shift allows for group selection, selecting all elements between the first selected item and the last selected.
Initial Plane Inclination
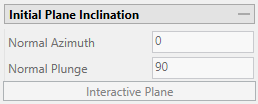
Normal Azimuth - (Disabled if Dip Plane First option has been selected.) Enter a strike angle. A strike of 90 degrees is set by default.
Normal Plunge - (Disabled if Dip Plane First option has been selected.) Enter a dip angle. A dip of 0 degrees is set by default.
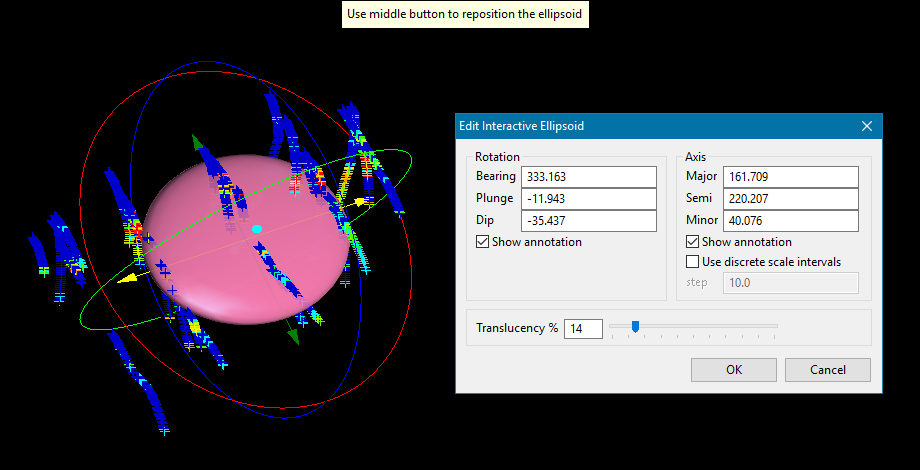
Interactive Plane - Click this button to open an interactive window in the Vulcan 3D viewer. You can use the controls on the ellipsoid to set the direction parameters.
Constant Parameters
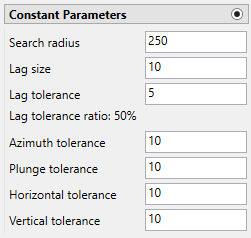
Constant Parameters allows you to use the same lag and tolerance parameters for all variograms. To set different lag and tolerance parameters for each variogram individually, see Directional Parameters below.
Search radius - The search radius should correspond to approximately half the distance of your data field. if the search radius is greater than the halfway point, then the search will over-extend the edge of the data.
Example: If the distance traversing your sample area is 500 feet, then set the search radius to 250 feet.
Lag size - The lag size is the search distance for each step from the origin. Set a lag size that coincides with your data spacing.
Example: If your samples are spaced 50 feet apart, then set your lag size to 50. If you have to err, do so on the side of too small.
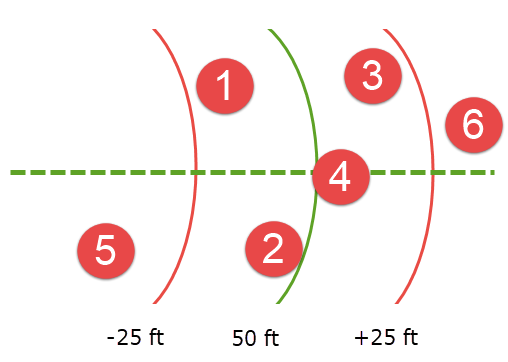
Lag tolerance - Enter the Cone tolerance settings. The tolerances are the angle limits between two samples and the centre line (range axis) of a variogram cone. Any two samples with an angle larger than this value are ignored.
Here, the dotted green line represents our search direction. The solid, curved green line represents a lag size (search distance) of 50 feet, and the red lines represent an area (lag tolerance) marking 25 feet on either side of our search distance. Samples 1, 2, 3, and 4 would be used in the calculation because they are located within the tolerance zone. However, samples 5 and 6 would be ignored.
Collectively, the azimuth tolerance, plunge tolerance, horizontal tolerance, and vertical tolerance are known as the Cone of Tolerance.
Lag tolerance ratio - This corresponds to the percentage of the lag size that is used by the lag tolerance.
Example: A lag size of 50 with a lag tolerance of 25 will result in a lag tolerance ratio of 50%.
Azimuth tolerance - The limit on the angle between two samples as measured in the plane of the plunge of the variogram.
Plunge tolerance - The limit on the angle between two samples as measured in a vertical plane in the direction of the azimuth.
Note: A combination of cone, azimuth and plunge tolerances is used if the azimuth angle tolerance and plunge angle tolerance are set to less than the cone angle tolerance.
Horizontal tolerance - The horizontal distance limit of sample pairs. Any acceptable sample must be within this horizontal distance from the centre of the variogram cone.
Tip: Set this value to a typical spacing (or larger) between your data, for example, if your data is on a 100 × 100 × 10 grid, set a horizontal distance of 100 and a vertical tolerance of 10. If you receive too few sample pairs, try increasing the tolerances to capture more data otherwise artefacts such as "hole effects" may occur.
Vertical tolerance - The vertical distance limit of sample pairs. Any acceptable sample must be within this vertical distance from the centre of the variogram cone. The vertical distance is measured from the plane of the plunge of the variogram cone.
Using too large of a cone can result in excessive mixing of samples from different directions. This can cause the apparent anisotropy to appear smaller than the true anisotropy.
Using too small a cone can result in rough variograms that are hard to interpret. The sample cone may be too small if the number of sample pairs for most lags is small compared to the number of sample points.
Note: For an omnidirectional variogram, use 90 for the azimuth tolerance and 90 for the cone angle tolerance.
Note: To disable the limit, set it to 90 degrees.
Note: If this is set to 0, then the tolerance is not used.
Directional Parameters
Directional Parameters allows you to set different lag and tolerance parameters for each variogram individually. To use the same lag and tolerance parameters for all variograms, see Constant Parameters above.
Click on the  button to bring up the Variogram Directions input table.

Editing table parameters
-
The table at the top is where the variogram parameters are entered.
-
Entering information into the cells and then pressing ENTER generates another row.
-
Highlighting one or more rows and pressing DELETE will delete the row(s).
-
If you do not wish to view the cones in Vulcan, click OK to accept and close the window.
Unfolding
The unfolding option is used in the case of deformed strata bound deposits. This can be applied to deposits where mineralisation is controlled by a structural surface that can be modelled. The specification file from a Grid Model is used.
Indicators
Enter the cutoff number that will become the threshold value. All values below the cutoff will be treated as 0, while all values equal to or above the cutoff will be treated as 1.

