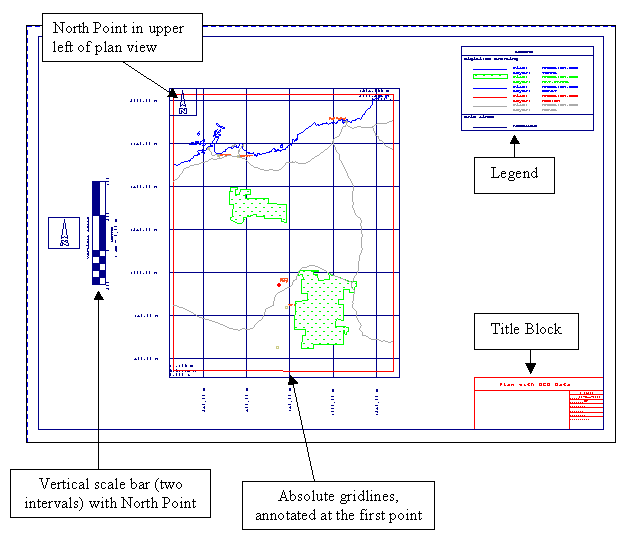
Plan with DGD Data
In this example, you create a plan plot of design data.
Plot of Design Data
Before selecting the Batch Plotting option, we recommend that you load all of the data that you want to plot into Vulcan. This will make it easier in the Data Elements section of the batch plotting process.
At any time you can click OK to save the specification file.
Data Extent
to set the extents of the plot.
Page Setup
to set the scale of the plot
Plot Elements
to turn on border, legend, title block, grid lines, and scale bar.
Data Elements
to specify data types to plot. Use Digitised Drafting to specify the design database(s) and layer(s) to plot.
Apply and Run
to create the plot file.
Data Extent
- Select the Data Extent option from the tree control in the left half of the panel.
- Select the Digitise Extent button.
- Indicate (by left-clicking) the lower left hand corner of the extent.
- Indicate (by left-clicking) the upper right hand corner of the extent.
- The fields on the Data Extent panel will now contain values.
- Ensure, by rotating the view, that the depth is applicable for your plot. That is, make sure that the data you want to plot is contained in the extents. Alter the depth if necessary.
Page Setup
- Select the Page Setup option from the tree control in the left half of the panel.
- Select the Specify page size by data extent and scale option.
- Enter a horizontal and vertical scale. Observe how as the scale changes the page width and height values (in the Calculated Page Measurement section of the panel) change.
- Alter the horizontal and vertical scales until you are satisfied with the size of the plot.
As the Plot Elements will effect the size of the plot, you will need to return to this section to verify the final size of the plot.
Plot Elements
- Select the Plot Elements folder from the tree control in the left half of the panel.
- Select the Border, Views, Gridlines - Absolute Grid, Title Block, Legend, Scale Bar and North Points check boxes.
- Select the Border option from the tree control in the left half of the panel.
- Select the colour and line type for the border.
- Select the Views option from the tree control in the left half of the panel.
- Select the Plot Plan View check box.
- Select a colour and line style for the border of the plan view plot.
- Select the Labels button.
- check Lower Left and Upper Right for the Easting, Northing and Elevation.
- Select the plus sign (+) to the left of the Gridlines option.
- Select the absolute option.
- Select the colour for the annotations and gridlines, and the line style for the gridlines.
- Enter the text height, number of decimal places for the annotations, size of the check marks and the spacing between the gridlines.
- Select the plus sign (+) to the left of the absolute option.
- Select the plan option.
- Select the Display Lines and Annotate first point check boxes for both Easting and Northing.
- Select to Annotate text Perpendicular to View Rectangle.
- Select the Title Block option from the tree control in the left half of the panel.
- Enter the title block information.
- Enter the length of the title block, select a colour for the title block and enter the text height.
- Select the Legend option from the tree control in the left half of the panel.
- Select a colour and line style for the legend.
Note: It is not necessary to change the default settings. Items that are checked that are not part of your plot (for example grid models) are not included in the legend.
- Select the Scale Bar option form the tree control in the left half of the panel.
- Select the Include Vertical Scale bar check box.
- Select the Draw at Left of Plot check box.
- Enter the number of intervals and the interval length. The plot displayed above has a length of 200 and two intervals.
- Select a colour, line type and pattern for the scale bar.
- Select the Northpoint option from the tree control in the left half of the panel.
- Select the Include with vertical scale bar check box.
- Select a colour, line style and pattern for the northpoint.
Data Elements
- Select the Digitised Drafting folder from the tree control in the left half of the panel.
- The design data displayed on the screen will be entered into the Digitised Drafting panel.
Data Extents
- Select the Data Extents option from the tree control in the left half of the panel.
- Check the page width and height. If necessary, alter the vertical and horizontal scales.
Apply and Run
- Select the Apply and Run button to create and save the plot file.
A preview of the plot file displays in the Plot Utility.

