Plan with Border Style and DGD Data
This example introduces the use of a border style while creating a basic plot of design data.
If you work through this example: then you will learn how to create a drafting sheet and how to utilise your drafting sheet while creating a plot of design data.
Creating the Drafting Sheet
Drafting Sheet
- Select the New option (under the File > Drafting Sheets submenu).
- Enter the name for the drafting sheet. Use the format BP_<Name>, for example 'BP_ENVIS'.
- Enter a description for the drafting sheet.
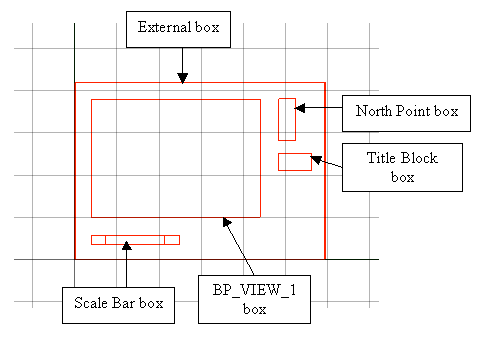
You will then be placed in the Drafting window, which will have the A0 template (both landscape and portrait )outline displayed. You will need to create different boxes to represent the various objects that you want to include in the plot. The colour and line style of these boxes will be the defaults, which are displayed through the Status toolbar.
- Select the External option (under the File > Drafting Sheets submenu). This option to set the size of the entire plot, that is, will the plot be A0, A4, B2, user-defined, etc.
- Select the paper size. For this example: select a standard paper size.
- Enter the line thickness. The above diagram uses the default thickness.
- Accept the External box.
Creating the Plan View Box
- Select the Internal option (under the File > Drafting Sheets submenu). This allows you to set the size of the plot data area.
- Indicate the origin of the internal box. You can use the Snap to Grid button
 on the Digitise toolbar to accurately place the origin.
 - Turn off the Use Scale Measurements check box.
- Enter the units of measurement.
- Indicate the second point of the Internal Box (this is the corner opposite to the origin).
- Enter the line thickness.
- Accept the Internal Box.
The Internal Box will be named 'INTERNAL', however, Batch Plotting requires that this box, which contains the plan view, has the name 'BP_VIEW_1'. Use the Name option (under the Design > Attribute Edit submenu) to change the object name.
Creating the North Point Box
- Select the North option (under the File > Drafting Sheets submenu).
- Indicate the coordinate origin of the North point.
- Enter the bearing of plan north.
- Accept the North point box. If the Northpoint box extends outside of your External box, then right-click on the North Point box and select Move from the displayed context menu.
Creating the Scale Bar Box
- Select the Scale option (under the File > Drafting Sheets submenu).
- Indicate the coordinate origin of the scale bar.
- Accept the scale bar box.
Creating the Title Block Box
To create the Title Block we need to create a rectangle and then name it 'TITLEBLOCK'.
- Select the Rectangle button
 from the Design toolbar.
 - Indicate the region that will be used to define the resulting rectangle. To do this, indicate the first point and drag the "rubber band" rectangle in any direction to the second point. Click to accept the second point.
- Create the rectangle.
- Use the Name option (under the Design > Attribute Edit submenu) and change the rectangle's object name to 'TITLEBLOCK'.
You have now created the drafting sheet. Use the Save option (under the File > Drafting Sheets submenu) to save your drafting sheet with your drafting database. Refer to the Drafting Sheets documentation for more information on drafting sheets. As different printers have different setups, that is different non-printable margins, you may need to change the positioning of your template objects.
Creating the Plot
Before selecting the Batch Plotting option, we recommend that you display all of the objects that you want to include in your plot. This will make it easier in the Data Elements section of the batch plotting process.
Page Setup
to select the border style.
Data Extent
to select the extents of the plot area.
Plot Elements
to turn on legend, title block, grid lines, and scale bar.
Data Elements
to specify data types to plot. Use Digitised Drafting to specify the design database(s) and layer(s) to plot.
Apply and Run
to create the plot file.
Page Setup
- Select the Page Setup option form the tree control in the left half of the panel.
- Select the Use drafting sheet option.
- Select your border style from the drop-down list. At this stage don't worry about any error messages in the Status field.
Data Extent
- Select the Data Extent option from the tree control in the left half of the panel.
- Select the Fit drafting sheet button.
- Enter the horizontal scale, select Apply Scale.
- Enter the Vertical Scale, select Apply Scale.
- Select the Drag Extents button.
- Drag the extents onto the objects that you want plotted. If the objects do not fit inside the extents, then reselect the Fit Drafting sheet button and alter the horizontal and vertical scales. Note these scales are not applied until you select the Apply Scales button.
- Ensure, by rotating the view, that the depth is applicable for your plot. That is, make sure that the data you want to plot is contained in the extents. Alter the depth if necessary.
Plot Elements
- Select the Plot Elements folder from the tree control in the left half of the panel.
- Select the Border, Views, Gridlines - Absolute Grid, Title Block, Scale Bar and North Points check boxes.
- Select the Border option from the tree control in the left half of the panel.
- Select the colour and line type for the border.
- Select the Views option from the tree control in the left half of the panel.
- Select the Plot Plan View check box. Deselect any other views.
- Select a colour and line style for the border of the plan view plot.
- Select the Labels button.
- Select Lower Left and Upper Right for the Easting, Northing and Elevation.
- Select the plus sign (+) to the left of the Gridlines option.
- Select the absolute option.
- Select the colour for the annotations and gridlines, and the line style for the gridlines.
- Enter the text height, number of decimal places for the annotations, size of the check marks and the spacing between the gridlines.
- Select the plus sign (+) to the left of the absolute option.
- Select the plan option.
- Select the Display Lines and Annotate first point check boxes for Easting and Display Lines and Annotate final point for Northing.
- Select to Annotate text Perpendicular to View Rectangle.
Note: The annotations are placed outside the BP_VIEW_1 box, so they may overlap with your scale bar or north point. If this is the case, then edit your drafting sheet.
- Select the Title Block option from the tree control in the left half of the panel.
- Enter the title block information.
- Select the Scale Bar option form the tree control in the left half of the panel.
- Select the Include Horizontal Scale bar check box.
- Select the Draw in drafting sheet box.
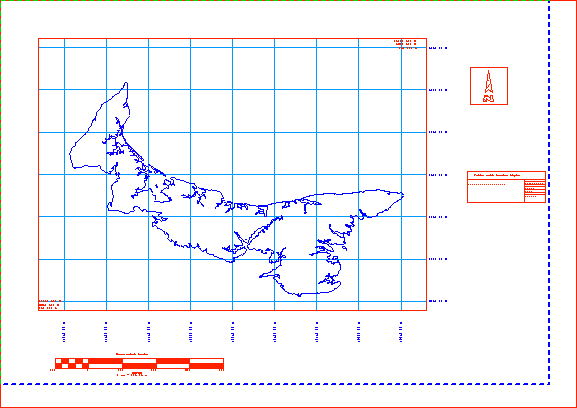
- Enter the number of intervals and the interval length. The plot displayed above has a length of 200 and four intervals.
- Select a colour, line type and pattern for the scale bar.
- Select the Northpoint option from the tree control in the left half of the panel.
- Select the Style check box.
- Select a colour, line style and pattern for the northpoint.
Data Elements
- Select the Digitised Drafting folder from the tree control in the left half of the panel.
- The design data displayed on the screen will be entered into the Digitised Drafting panel.
The Status field in the Data Extents panel should no longer contain error messages.
Apply and Run
- Select the Apply and Run button to create and save the plot file.
A preview of the plot displays in the Plot Utility.

