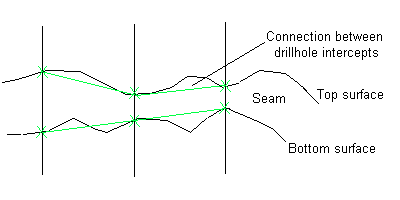
Long-Section (flexed) with Drilling and Paired Grid Surfaces
In this example: you will plot a single grid surface (topo) and a paired surface (roof and floor), along with some drilling information. This example is the same as Section with Drilling and Paired Grid Surfaces, but is different in that the cutting plane with which the grids are profiled are defined by you into multiple section segments, each segment having a different azimuth. Some might call this a long-section (coal), others might call this a "flexed" section. Note that this operates much the same as the profiling found in the Cross Section option when using the user-defined method.
Cross Section through Paired Surfaces
Flexed Section with Drilling and Paired Grid Surface
Before creating your batch plotting specification file, we recommend that you load all of the data that you want to plot into Vulcan. This will make it easier in the Data Elements section of the batch plotting process.
Data Extent
to set the extents of the plot and to create the flexed section.
Page Setup
to set the scale of the plot
Plot Elements
to turn on border, views, legend, title block, grid lines, scale bars and north points.
Data Elements
to specify data types to plot. Use Database fields to specify the drillholes and Grid Models to specify the grid models to plot.
Apply and Run
to create the plot file.
Data Extent
- Select the Data Extent option from the tree control in the left half of the panel.
- Select the Use flexed section radio button.
- Select the Digitise Section button.
- Indicate (by clicking) the section line. Right-click when you have finished digitising the section.
Note: If you want your section line to have changing Z values, then alter the default Z value (in the Status toolbar) between indicating section points.
It is also possible to specify the flexed section as part of the grid model specifications (Model Attributes - Section Tab).
- The fields on the Data Extent panel will now contain values.
- Ensure, by rotating the view, that the extent is applicable for your plot. That is, make sure that the data you want to plot is contained in the extents. Alter the thickness and elevation values if necessary.
Page Setup
- Select the Page Setup option from the tree control in the left half of the panel.
- Select the Specify page size by data extent and scale option.
Note: It is not possible to plot a flexed section with any of the other page specification options.
- Enter a horizontal and vertical scale. Observe how as the scale changes the page width and height values (in the Calculated Page Measurement section of the panel) change.
- Alter the horizontal and vertical scales until you are satisfied with the size of the plot.
As the Plot Elements will effect the size of the plot, you will need to return to this section to verify the final size of the plot.
Plot Elements
- Select the Plot Elements folder from the tree control in the left half of the panel.
- Select the Border, Views, Gridlines - Absolute Grid, Title Block, Legend, Scale Bar and North Points check boxes.
- Select the Border option from the tree control in the left half of the panel.
- Select the colour and line type for the border.
- Select the Views option from the tree control in the left half of the panel.
- Select the Plot Section View check box.
- Select a colour and line style for the border of the section view plot.
- Select the Plot Plan View check box.
- Select a colour and line style for the border of the plan view plot.
- Select the plus sign (+) to the left of the Gridlines option.
- Select the absolute option.
- Select the colour for the annotations and gridlines, and the line style for the gridlines.
- Enter the text height, number of decimal places for the annotations, size of the check marks and the spacing between the gridlines.
- Select the plus sign (+) to the left of the absolute option.
- Select the section option.
- Select the Display Lines and Annotate first point check boxes for all options.
- Select to Annotate text Perpendicular to View Rectangle.
- Select the plan option.
- Select the Display Lines and Annotate first point check boxes for all options.
- Select to Annotate text Perpendicular to View Rectangle.
- Select the Title Block option from the tree control in the left half of the panel.
- Enter the title block information.
- Enter the length of the title block, select a colour for the title block and enter the text height.
- Select the Legend option from the tree control in the left half of the panel.
- Select a colour and line style for the legend.
Note: It is not necessary to change the default settings. Items that are checked that are not part of your plot (for example triangulation models) are not included in the legend.
- Select the Scale Bar option form the tree control in the left half of the panel.
- Select the Include Vertical Scale bar check box.
- Select the Draw at Left of Plot check box.
- Enter the number of intervals and the interval length. The plot displayed above has a length of 200 and two (2) intervals.
- Select a colour, line type and pattern for the scale bar.
- Select the Include Horizontal Scale bar check box.
- Select the Draw at Bottom of Plot check box.
- Enter the number of intervals and the interval length. The plot displayed above has a length of 200 and two(2) intervals.
- Select a colour, line type and pattern for the scale bar.
- Select the North point option from the tree control in the left half of the panel.
- Select to include the north point in the upper left corner of both the plan and section views.
- Select a colour, line style and pattern for the north points.
- Return to the Page Setup panel and ensure that the plot size is still appropriate. Alter the scale if necessary.
Data Elements
If fields appear on panels, but are not mentioned in the following instructions, then leave them as their default value.
Database Fields
- Select Database Fields from the tree control in the left half of the panel.
If you displayed the drillholes on the screen prior to selecting Batch Plotting, then many of the steps described below will have been completed for you.
- Click in the Field column. The Field Selection panel displays.
- From this panel specify the file type (Drillhole Database), the datasheet (also referred to as design), the identifier (name of the database), record (also referred to as table) and the Field.
- Click OK.
- Click in the Interval Construction column. The Interval/Point Construction method panel displays.
- If the drilling intervals are defined by "from's" and "to's", then select Top and Bottom depths. If the drilling intervals are defined only by a series of "to's", then select Bottom depth or if the drilling intervals are defined by "to's" in conjunction with thickness, then select Thickness and Bottom depth. The system will select an option based on the fields in your chosen database, but you can select an alternative.
- Click OK.
- Click in the Trace column. The trace panel displays.
- Enter the first and second offsets for the trace for both plan and section views. The first offset in the above plot was 0.000 and the second offset was 0.038.
- Select a Patterned Symbol for the vertical traces in plan view. Also select a colour and pattern for the symbol.
- Select to include the trace in the Section and Plan view.
- Select the Attributes option from the tree control on the Trace panel.
- Choose a single colour or a colour scheme for the trace. The above plot was coloured using a scheme.
- Click OK.
- Click in the Checks column. The Checks panel displays.
- Enter a first and second offset for the checks for the section view. The first offset in the above plot was 0.038 and the second was 0.173.
- Select to include the Start of Interval check in the Section view.
- Select to include the End of Interval check in the Section views.
- Select the Attributes option from the tree control on the Checks panel.
- Choose a single colour or a colour scheme for the checks. The above plot was coloured using a single colour.
- Click OK.
- Click in the Annotation column. The Annotation panel displays.
- Enter the horizontal offset for the annotations for the plan view. The offset for the above plot was 0.188.
- Enter a text height. The text height for the above plot was 0.1
- Select to include the annotations in the Plan view. That is, clear the Section and Width views.
- Select the Attributes option from the tree control on the Annotations panel.
- Choose a single colour or a colour scheme for the annotations.
- Click OK.
Grid Models
- Select the Grid Models option from tree control in the left half of the panel.
If you displayed the grid models on the screen prior to selecting Batch Plotting, then many of the steps described below will have been completed for you.
- Click in the Grid Model column.
- Select from the drop-down list, or click
 to navigate to, the topography grid model that you want to include in the plot.
 - From the Plot Style drop-down list select Profile.
Note: If you have displayed the grid models on the screen, then you will have three grid models specified on this panel. However, to use paired grid surfaces you need to remove one of the rows that contain one of the paired surface grids. To do this, right-click on the row and select Delete Row.
- Click in the grid model column.
- Select from the drop-down list, or click to navigate to, one of the surface grids.
- From the Plot Style drop-down list select Profile.
- Select the check box in the Use Paired Surface column.
- Click in the Paired Grid Model column.
- Select from the drop-down list, or click to navigate to, the second surface grid.
- Click in the Model Attributes column.
- On the Display tab, Select the Label Profile check box.
Note: If you chose to use plan or section measurements when specifying the extent, then use the options on the Section Tab to specify the flexed section.
Apply and Run
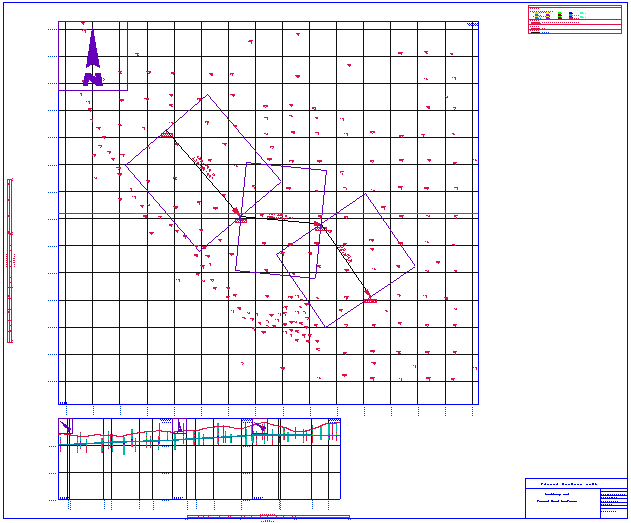
- Select Apply and Run to create the plot file. Note that when you select Apply and Run, the specification file is saved.
A preview of the plot displays in the Plot Utility.

