Periods
Periods are used to manipulate the frequency of reporting in the generated summary report.
On the Setup tab, in the Period group, click Periods.
General Workflow
-
Click
 in the upper left corner of the dialog box to add a new period configuration.Note
To modify an existing entry, select the period from the list and change the displayed information as needed.
To create a copy of the selected entry, select a period from the list and click
 Copy or press
 CTRL+C.To remove a selected entry, click
 Remove or press
 Delete. The entry can only be removed if it is not being used in the project. -
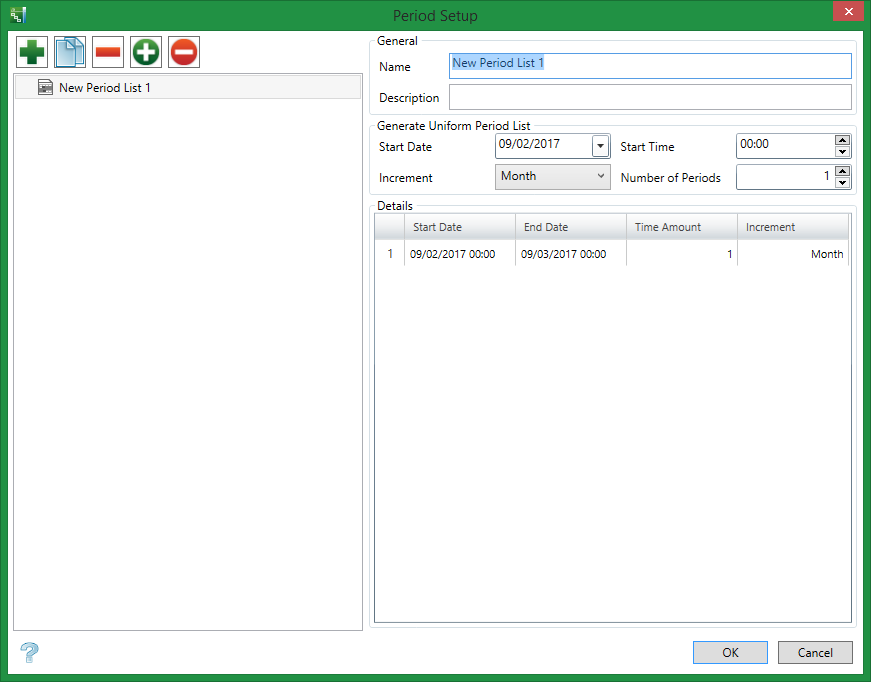
Enter the Name for the period.
-
Select a Start Date and Start Time for the period.
-
Choose an Increment time span.
-
Enter the Number of Periods required.
-
The Details grid populates based on selections made in the Generate Uniform Period List area.
-
You can select an entry and click
 Set Current to set it as the current selection in the tab group. Click
  Reset Current to reset the selection.
 -
Click OK when all periods are configured.
-
On the Setup tab, in the Period group, select the desired configuration as the Current Period from the drop-down list.
General
Name
Name of the activity type used in the whole project.
Description
A brief description of the activity type.
Details
To configure non-uniform periods:
-
Determine the number of periods required.
-
Select a Start Date, Start Time, and Increment.
-
Enter a Number of Periods that matches the number of periods required.
-
Individually modify the Increment column for each row in the Details grid.
-
Individually modify the Time Amount column for each row in the Details grid.
The Current Period selected on the Setup tab in the Period group affects Summary Report functionality. If a custom period is chosen:
-
Day, Week, Month, and Year buttons located in the Overview Area of the Gantt Chart window will not affect Summary Report appearance.
-
The link between the Summary Report and the displayed Gantt Chart is lost.
-
The Summary Report exports to CSV with the applied periods.

