Database Drift Analyser - Define Moving Window
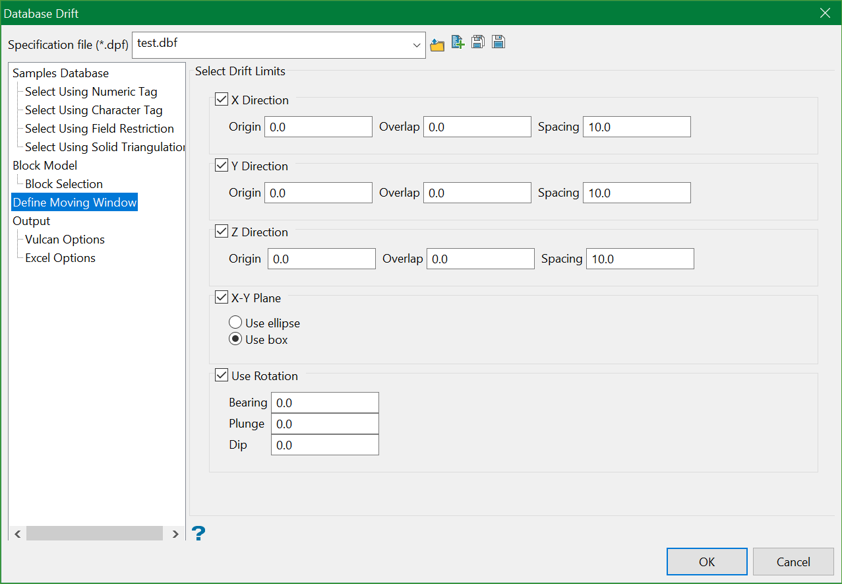
This section allows you to define the directions of the window slices. You are able to calculate X, Y or Z direction slices, or all the directions. If the X and Y directions slices are selected for calculation, then the X-Y averages can also be calculated. In this case the space will be separated into squares the size of the X slice, by the size of Y slice.
A search ellipsoid or search box can be used to look for samples. Rotation is used to look for averages aligned in directions different to that of the Cartesian axis.
XY drift charts in Excel (2D surface) are limited to 255 classes. This is due to the maximum number of columns that Excel allows.
Select drift limits
X direction
Select this check box to calculate grades along the X-axis slice.
Origin
Enter the origin value to define the starting point of each slice, or if the Use rotation check box is selected, then it will also specify the rotation centre.
Overlap
Enter the overlap value to allow a smooth transition between consecutive slices. This works by taking the values outside of the slice, but in the specified overlap distance.
Spacing
Enter the spacing value to define the thickness of each slice.
Y direction
Select this check box to calculate grades along the Y-axis slice.
Origin
Enter the origin value to define the starting point of each slice, or if the Use rotation check box is selected, then it will also specify the rotation centre.
Overlap
Enter the overlap value to allow a smooth transition between consecutive slices. This works by taking the values outside of the slice, but in the specified overlap distance.
Spacing
Enter the spacing value to define the thickness of each slice.
Z direction
Select this check box to calculate grades along the Z-axis slice.
Origin
Enter the origin value to define the starting point of each slice, or if the Use rotation check box is selected, then it will also specify the rotation centre.
Overlap
Enter the overlap value to allow a smooth transition between consecutive slices. Â This works by taking the values outside of the slice, but in the specified overlap distance.
Spacing
Enter the spacing value to define the thickness of each slice.
X-Y plane
Select this check box to calculate the x slice by the y slice averages. Select this check box to calculate the x slice by the y slice averages. If the Excel output option is selected, a 3-D drift analysis chart will appear in the output, indicating the mean grade of the analysed material in terms of its X, Y, and X coordinates. An example is shown below.
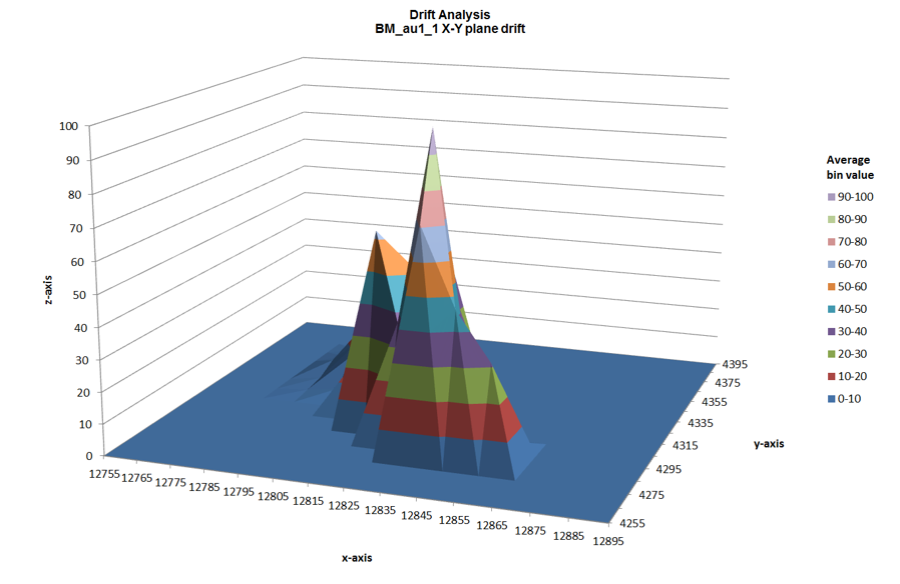
Figure 1: X-Y chart example
Use search ellipse
Select this option to limit the search distance to an ellipsoid, as shown in the diagram below.
Use box
Select this option to limit the search distance to a box instead of an ellipsoid, as shown below.
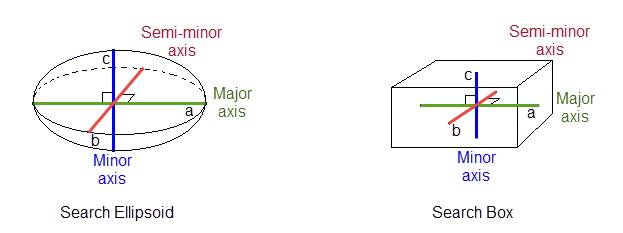
Figure 2: Search Ellipsoid/Search Box
Select this check box to perform analysis in an orientation different from the Cartesian coordinates. For Bearing, Plunge and Dip, enter the orientation of the data. If you do not know the orientation of a block model, go to Block > Header to get the rotation values.
The bearing, plunge and dip values follow standard block model rotation and indicate the orientation of the rotated structures. For more information, see Bearing, Dip and Plunge (in Block > Grade Estimation > Estimation Wizard > Ordinary Kriging).

