Load Design Database Information
Use the Load Design option to load design data into the Grid Calc buffer. This option can also be accessed by selecting the Load Design Data button  from the Grid Calc toolbar.
Note: To display the design data as it is loaded, check the Automatically display data check box on the Preferences panel (displayed through the Preferences option).
Instructions
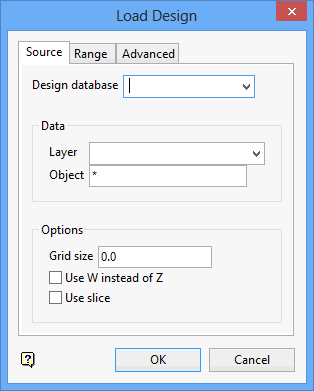
On the Grid Calc menu, point to Data, and then click Load Design to display the Load Design panel.
Source tab

Design Database
Select the design database that contains the data.
Data
Layer
Enter, or select from the drop-down list, the name of the layer that contains the necessary data. Wildcards (* multiple character and % single character) may be used.
Object
Enter the names of the objects to be loaded. Wildcards (* multiple character and % single character) may be used. The default value is *, which will load all objects.
Options
Grid size
Enter the grid size to be used during modelling.
Use W instead of Z
Select this check box to load the W tags with the X and Y values instead of Z values.
Use slice
Check this box to load only the values (interpolated or real) of string data at grid line intersections. This can be used to reduce the amount of data loaded (although it can increase it if the grid size is small). This option should only be applied to string data types.
Important This check box must be selected when the spline modelling method is to be used on the data. Refer to the Grid Model option (under the Grid Calc > Model submenu) for information on the spline modelling method.
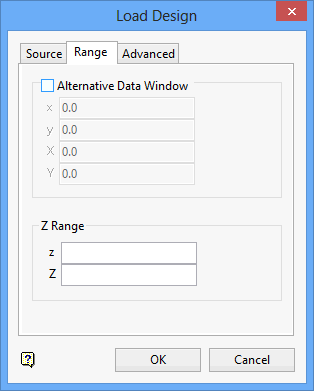
Range tab

Alternative Data Window
These field allow you to limit the data being loaded to a specified geographic extent. Specify the minimum and maximum X and Y values ( x and y fields are for the minima and X and Y are for the maxima). Points falling outside this region are not loaded. This will also be the default extents during modelling.
Z Range
These fields allow you to limit the data being loaded to a specified Z range. Specify the minimum and maximum Z values ( z field is for the minimum and Z field is for the maximum ). Points with Z values (or W tag values) falling outside of this range are not loaded.
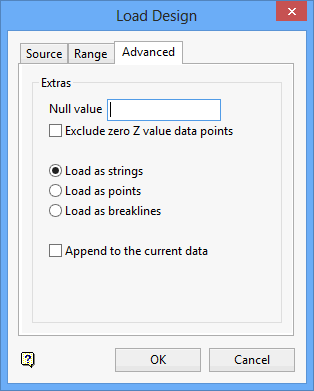
Advanced tab

Extras
Null value
Enter the null value. If a point has a Z value (or a W tag value) equal to this value, it is not loaded.
Exclude zero Z value data points
Select this check box to exclude points with zero (0) Z valued (or W tag values) from the load.
Select whether to load the data as strings, points, or breaklines. Triangles cannot form across breaklines. Therefore, if the triangulation modelling method is used the grid will honour these lines.
Append to the current data
Select this check box to append the data to the current set of data. If this check box is not selected, then the current set of data will be cleared first.
Click OK.
The data is then loaded.
To display the data, use the Display > Design Data option or type the following command in the Grid Calc command line: plot_data
In both cases, if you set default data display attributes (through the Data Display Defaults option), then the design data displays. Otherwise, the Design Display Attributes panel displays and you must set the attributes.

