Display Data 
Use Display Data to display previously loaded design data that currently resides in the Grid Calc buffer. If you need to load design data, refer to the Load options in the Grid Calc > Data submenu.
To display data automatically as it is buffered, check the Automatically display data check box from the Grid Calc > Display > Preferences panel.
It is also possible to display data using the default data display attributes, which eliminates the need to complete the Design Data Display Attributes panel each time design data displays. To do so, check the Use default design data attributes check box on the Display > Preferences panel.
To set the default data display attributes, use the Grid Calc > Edit Modelling Defaults > Data Display Defaults option.
You can also display data by typing plot_data in the command line.
Instructions
On the Grid Calc menu, point to Display, and then click Display Data.
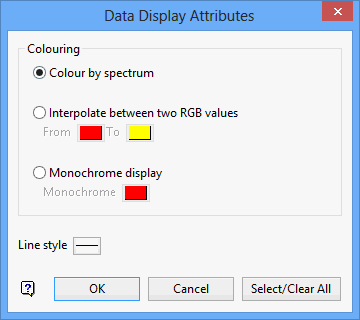
The design data is either displayed using the default settings (if you have the Use default data attributes preference is set), or the following panel displays.

Colouring
Colour by spectrum
Select this option to stretch the colour spectrum over the z values. Thus, the small z values are represented by the colour red, while the largest z values are represented by violet.
Interpolate between two RGB values
Select this option to stretch two colours over the z values. For example, if you selected red and blue, the small z values would be red, middle z values purple and the large z values blue. The colour of the middle values is an average of the two chosen colours.
Monochrome display
Select this option to display the data using one colour.
Line Style
Select the line style to use when displaying the design data.
Click OK.
The design data displays on the screen as an underlay, which can be removed using either the Display > Remove Underlay or Display > Clear All Grid Calc Underlays options.

