Dynamic Display Grid 
Use Dynamic Display Grid to dynamically display the currently buffered grid on the screen. The grid can be displayed with accurate Z values or exaggerated Z values; with a spectrum of colours or monochromatically; and with or without gridlines.
As this display option is dynamic, it will be updated with any changes made to grid values. Use the Display > Static Display Grid option for a static display, (not updated automatically when the grid data change).
You can only display one grid using the Dynamic Display Grid option.
To display grids automatically as they are buffered, check the Automatically display grids check box on the Preferences panel from the Display > Preferences panel. To dynamically display the grid, you will also need to check the Use dynamic grids check box on the same panel.
It is also possible to display grids using the default grid display attributes, which eliminates the need to complete the Grid Display Attributes panel for each grid. To use the default grid display attributes, check the Use default grid attributes check box on the Display > Preferences panel.
To set the default grid display attributes, use the Grid Calc > Edit Modelling Defaults > Grid Display Defaults option.
If you choose to display the grid using a spectrum of colours, a legend (Grid Scale Bar) displays indicating which colour represents which Z value. You can hide and show the Grid Scale Bar by selecting the Display Grid Scale Bar button ![]() on the Grid Calc toolbar, or using the Display > Display Grid Scale Bar option. As the Grid Scale Bar displays as a floating window, it is possible to dock, hide and convert this window to a client window.
on the Grid Calc toolbar, or using the Display > Display Grid Scale Bar option. As the Grid Scale Bar displays as a floating window, it is possible to dock, hide and convert this window to a client window.
Prerequisites
You must first open a grid. See Grid Calc > Grids > Load/Calculate Grid for detailed instructions.
Instructions
On the Grid Calc menu, point to Display, and then click Dynamic Display Grid.
The grid is either displayed using the default settings (if you have the Use default grid attributes preference set) or following panel displays.
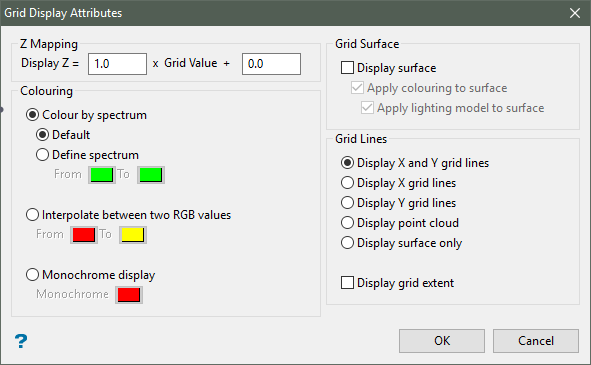
Z Mapping
![]()
The z values of the display can be the grid values or an exaggerated and offset version of the grid values. If the grid you want to display is of a structure or topological feature, (i.e. the grid values are "real world" values), enter "1" in the first field and "0" in the second to have the display z equal to the grid z. However, if the grid you want to display is of, say a quality variable, you might like to exaggerate the values so that small differences in value are easily observable on the screen.
For example:
|
Display Z |
Z Mapping |
|
|
True z mapping. The display z values are equal to the grid z values. |
|
|
Exaggerated z mapping. |
|
|
Exaggerated and offset z mapping. This allows various grids to be "stacked". |
Colouring
Colour by spectrum
Select this option to stretch the colour spectrum over the z values. Thus, the small z values are represented by violet/purple, mid range z values by aqua/green and the highest values by red/white.
Interpolate between two RGB values
Select this option to stretch two colours over the z values. For example, if you selected red and blue, the small z values would be red, the middle z values purple, and the large z values blue. The colour of the middle values is an average of the two chosen colours.
Monochrome display
Select this option to display the grid using one colour. If you also choose Apply lighting model to surface, then differences in z values are observable as differences in colour saturation.
Grid Surface
Display surface
Select this check box to display the surface.
Apply colouring to surface
Select this check box to apply the nominated colouring to the surface. This will also remove hidden lines from the display.
Apply lighting model to surface
Select this check box to apply lighting to the surface. The colours of the surface will change depending upon their orientation from the light source.
Grid Lines
Display X and Y grid lines
Select this option to display the X and Y grid lines
Display X grid lines
Select this option to display the X grid lines.
Display Y grid lines
Select this option to display the Y grid lines.
Display point cloud
Select this option to display the intersections of the X and Y grid lines.
Display surface only
Select this option to display the surface without grid lines or points.
Display grid extent
Select this check box to display the grid extent. A check box will be drawn around the grid representing the extent of the grid.
Click OK.
The grid displays on the screen and the grid values are automatically updated as you make changes. For information on removing grids from the screen refer to the Display > Remove Underlay or Display > Clear All Grid Calc Underlays options.

