Data Display Defaults
Use Data Display Defaults to set the default graphical display attributes for design data. It is then possible, by using the Preferences option, to display data using these defaults.
You can also save these attributes into the specification file (through using the Save Grid Specifications option). Thus eliminating the need to reset the attributes in each Grid Calc session.
Instructions
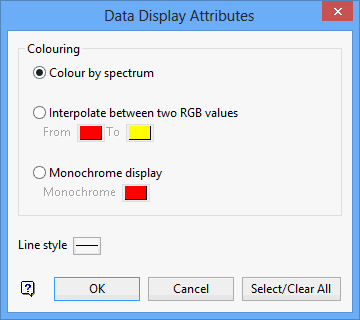
On the Grid Calc menu, point to Edit Modelling Defaults, and then click Data Display Defaults to display the Data Display Attributes panel.

Colouring
Colour by spectrum
Select this option to stretch the colour spectrum over the z values. Thus, the small z values are represented by the colour red, while the largest z values are represented by violet.
Interpolate between two RGB values
Select this option to stretch two colours over the z values. For example, if you selected red and blue, the small z values would be red, middle z values purple and the large z values blue. The colour of the middle values is an average of the two chosen colours.
Monochrome display
Select this option to display the data using one colour.
Line Style
Select the line style to use when displaying the design data.
Click OK.
The defaults are saved and if you have chosen to display data with default grid attributes, then any design data that you now load will have these graphical attributes.
Note: Design data already displayed will not be updated. To update displayed design data, use the Display Data option (under the Grid Calc > Display submenu).
Use the Save Grid Specifications option to save the attributes into the specification file.

