Histogram 
Use Histogram to display a simple histogram in the Report Window. The histogram is created using the active (non-masked) grid values. This option is used to view the distribution of grid values.
Instructions
On the Grid Calc menu, point to Grid Query, and then click Histogram option
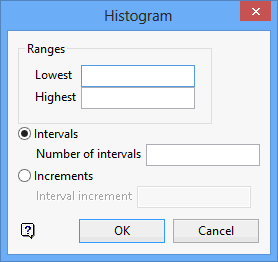
The following panel displays.

Ranges
Enter the histogram range. If used in conjunction with Intervals, then the range is divided into 'n' intervals. For example, if the range is 0 to 100 and the number of intervals is 5, then the histogram boundaries are 0-20, 20-40, 40-60, 60-80, 80-100.
If used in conjunction with Increment, then the histogram consists of a number of intervals the width of the increment value. For example, if the range is 0 to 100 and the increment value is 10, then the histogram boundaries are 0-10, 10-20, 20-30, 30-40, 40-50, 50-60, 60-70, 70-80, 80-90, 90-100.
Intervals
Select this option to use intervals. Enter the number of intervals.
Increment
Select this option to use increments. Enter the increment value.
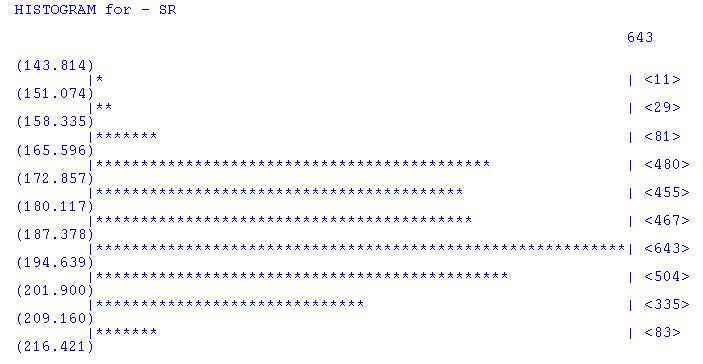
Note: Leave the fields in the Histogram panel blank if you want the Histogram option to determine its own range. Once the OK button has been selected, a histogram with 10 equal divisions between the lowest and highest values will be generated.
Click OK.
The histogram displays in the Report Window.

Figure 1: Report Window Output

