Statistics 
Use Statistics to display statistics relating to the last grid loaded. The minimum and maximum grid values, the Z range, the Z mean, the number of active (not masked) points, the active area (actual area of region not masked) and the total grid area displays through the Report Window.
Use the Data > Data Statistics option if you require statistics about data points.
Instructions
On the Grid Calc menu, point to Grid Query, and then click Statistics option
The information displays in the Report Window.
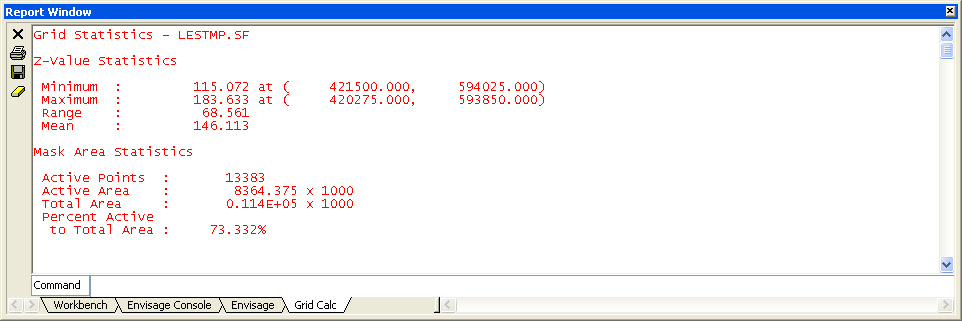
Figure 1: Report Window Output

