Grids
A grid is a 2D array of values. Each value is spaced from the previous by a fixed amount which is called the grid size, or grid cell size.
Note: A grid model although 2 dimensional is not necessarily planar (see the diagram below).
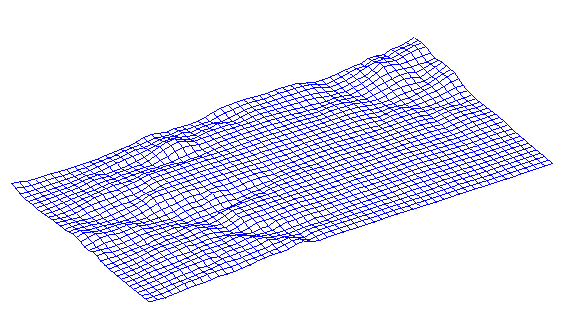
Figure 1: Grid Model (rotated with no colour applied to the surface)
Grids provide some special advantages when compared to alternative interpolative nets (for example, triangular nets). They
- are simple to use.
- are easy to manipulate.
- cover rectangular regions.
- can be defined by three parameters: grid origin, grid cell size, and a list of values.
- can be used to approximate surfaces.
- are efficient to compute.
Grid surfaces can
- represent physical surfaces (terrain, aquifers etc.).
- represent statistical surfaces, such as the intensity of a magnetic field over a region, or the change in a geochemical value over a region.
- provide a regular array of values over a region to a resolution determined by the grid size.
- provide an easy method to determine values for arbitrary locations.
The location of each value in the grid may be specified by the row and column in which it falls. If a grid is aligned on a known coordinate axis, for example, the UTM coordinate system, then each location is specified by its Cartesian coordinates (X, Y).
If the coordinates for a value are known, the coordinate location of any other value can be determined if the grid size and ordering of the values are also known. An increasing X coordinate value corresponds to an increase in the column number. Similarly, as the Y coordinate value increases, the row number increases.
In geographical terms, these X and Y values are referred to as "Eastings" and "Northings". For example, if a point is located at the grid origin, that is, Row 1, Column 1, then rows increase to the north, and columns increase to the east.
For each grid location, there can only be a unique value. Hence grids cannot represent folded surfaces.
Surfaces are derived from empirical values collected in the field, generally in a random pattern. If sample point values were the only interest, then the grids would not be required.
Typically, there is no need to interpolate between values. Interpolation methods are generally slow whereas knowing a value at an arbitrary point is immediate.
It is not always necessary to interpolate over an entire rectangular grid area. Rather than placing null values at points of no interest, an additional value, known as a "mask value" is stored at each grid location. The mask value is a switch that says whether the grid value at that point is of interest or not. Points switched off are still assigned the best theoretical value, so that any time a masked area is to be viewed, the grid does not have to be regenerated. The point is just switched back on. A mask of zero implies that a point is switched off, and a non-zero value implies on.
For more information on masks, see Naming and Referencing Masks.

