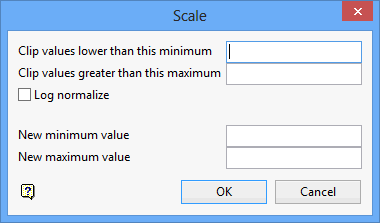
Scale
Use the Scale option to scale a grid using a variety of functions.
The functions are:
- Clip a grid at a lower Z value.
- Clip a grid at an upper Z value.
- Log-normalise a grid.
- Rescale a grid so the Z values fall between a specified minimum and maximum values.
- Clip Z values (for example, remove all values less than zero).
Instructions
On the Grid Calc menu, point to Model, and then click Scale to display the Scale panel.

Clip values lower than this minimum
Select this option to clip grid values less than a specified minimum. All values less than this minimum will be set to the minimum. Enter the minimum value.
Clip values greater than this maximum
Select this option to clip grid values greater than a specified maximum. All values greater than this maximum will be set to the maximum. Enter the maximum value.
Log normalize
Select this option to Log-Normalise the grid. This means that the data values are converted to base 10 logarithms. The lower bound is automatically set to zero (o). This option is quite useful in 'de-amplifying' the range of the data. For example if your data includes values of 10, 100 and 1000, when log-normalised the values will be 1, 2 and 3.
New minimum value
Enter the new minimum value for the Z values. The data values will be scaled so that the lowest data value is equal to the new minimum value.
New Maximum
Enter the new maximum value for the Z values. The data values will be scaled so that the highest data value is equal to the new maximum value.
You also have the option of specifying only one rescale value. If just the lower value is specified, then the grid is rescaled so that the Z values fall between the new lower value and the grid's current maximum. If just an upper value is specified, then the grid is rescaled so that the Z values fall between the current minimum and the new upper value.
Note: It is not necessary to enter values in each field. For example, you can choose to log-normalise the data or to log-normalise the data and specify new maximum and minimum values. In which case the data is log-normalised and then scaled to fit the new minima and maxima.
Click OK.
The grid is then scaled. If you chose to display the grid dynamically, then the grid is updated automatically. If you did not choose to display the grid dynamically, redisplay the grid using the Static Display Grid option.

