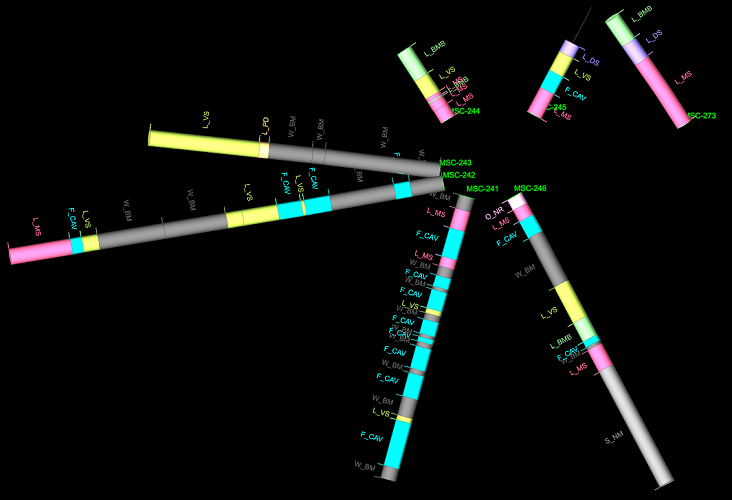
With a wealth of information locked up in the drilling database, visualising what you need when you need it is key to getting the most from your data. The drillhole visualisation options in Vulcan GeologyCore allow for easy display of drillholes, using existing or automatically generated legends.
|
|
Visualisation breakdown
Drillholes can be visualised in a variety of ways. Information from multiple drillhole tables and fields can be displayed at once, as either:
-
A drillhole with intervals—visualised as a sequence of cylindrical objects given a nominal diameter in space, coloured according to a legend.
-
A left or right label adjacent to the drillhole, coloured according to a legend. Various label visualisations are possible, depending on the field type, including text labels, line traces and “flags”.
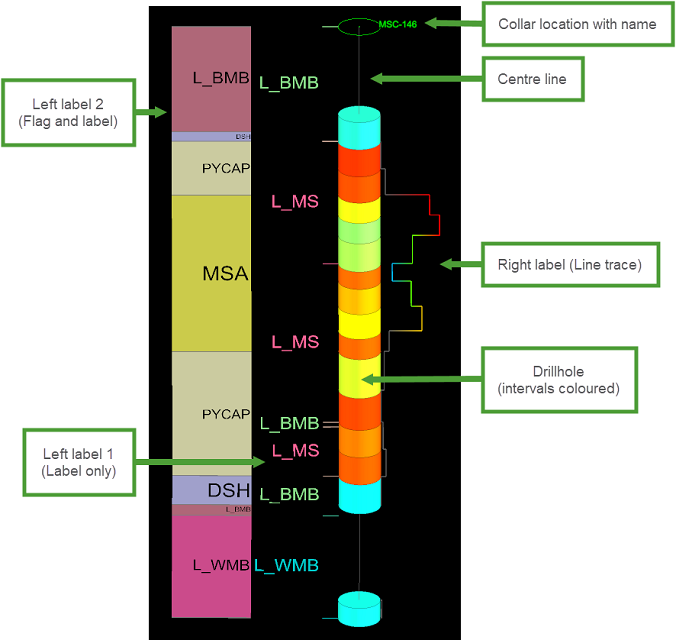
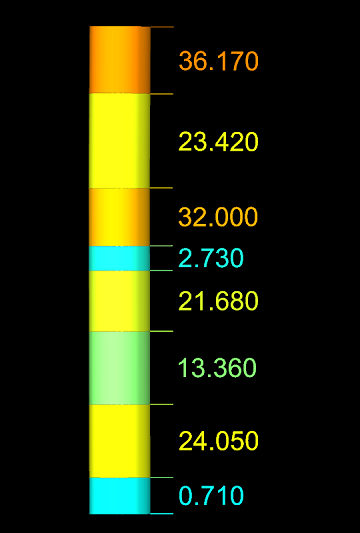
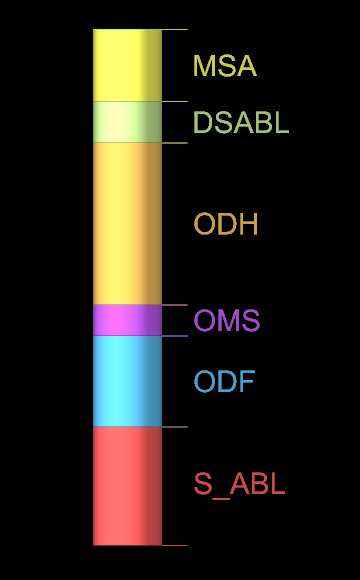
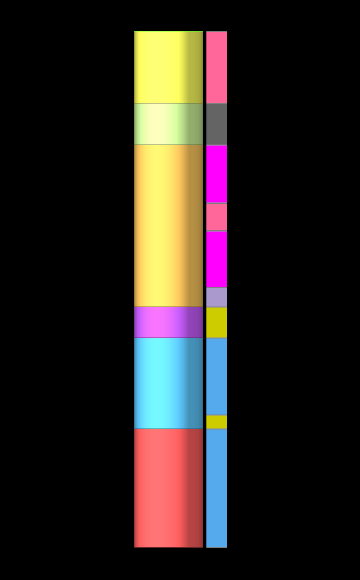
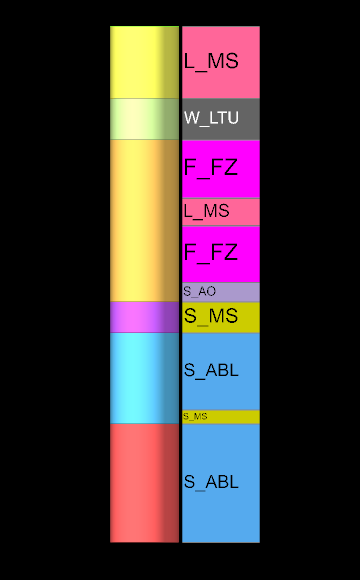
The image shows a single drillhole displaying information from four separate fields:
-
The drillhole itself represents an assay field, where each interval is coloured according to a numeric legend. The drillhole is given a nominal diameter of 1 m to show the intervals clearly. The centre line shows the drillhole trace for missing intervals for that field.
-
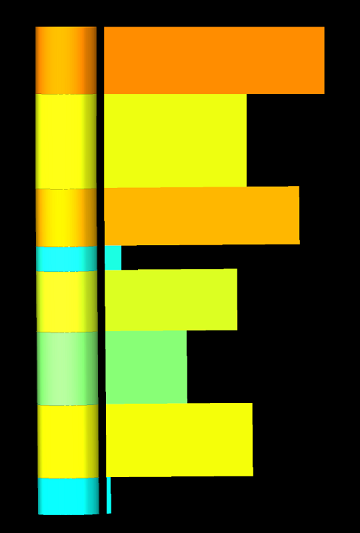
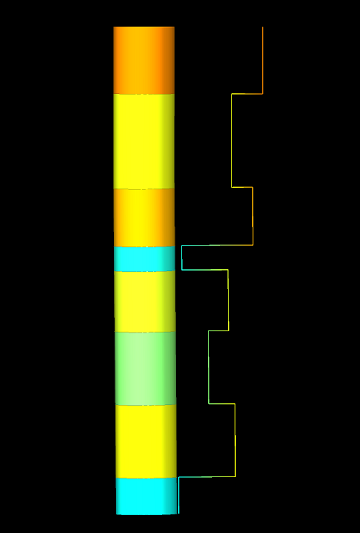
To the right of the drillhole another assay field is displayed using a line trace, coloured by another numeric legend.
-
To the immediate left of the drillhole a geocode field is displayed using a text label, coloured by a string legend.
-
To the left of that a domain code field is displayed using a “flag” visualisation coloured by a string legend, and a text label.
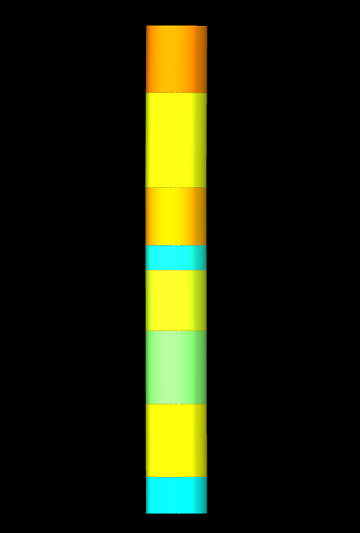
Visualisations for decimal fields
Decimal (floating-point) fields—such as assay values for a given element—can be visualised as a drillhole only, or as a drillhole label using text, or a solid or line trace (similar to a graph) to depict the value at each interval, coloured using a numeric legend.
| Drillhole only |
Drillhole with label | Drillhole with solid trace | Drillhole with line trace |
|
|
|
|
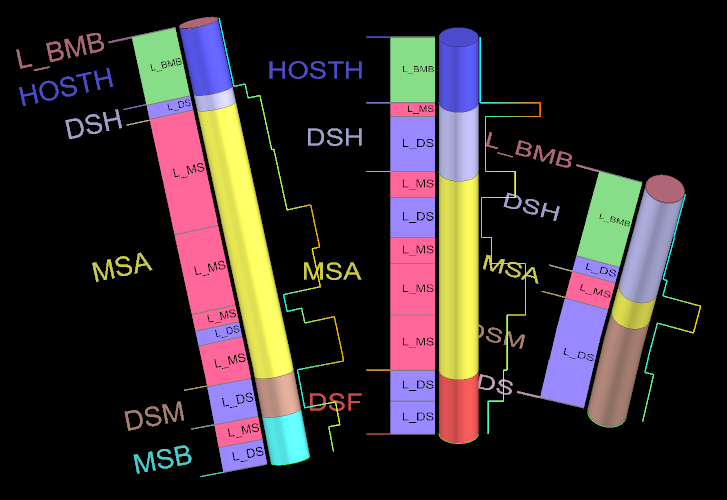
Visualisations for text and integer fields
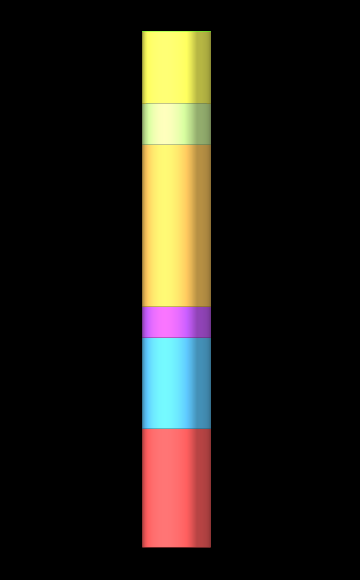
Text or integer fields—for example, containing domain or geology codes—can be visualised as a drillhole, or as a drillhole label using text and/or a “flag” (a rectangle coloured using the string legend).
| Drillhole only (single field) | Drillhole with right label (single field) | Drillhole with right flag label (2 different fields) | Drillhole with right flag and label (2 different fields) |
|
|
|
|
Changing drillhole visualisation
To get started with drillhole visualisation, follow these steps:
-
Select the drillholes
 you’d like to change the visualisation of. This could be a subset of drillholes, or all the drillholes in one or more databases.
  Expand to see how to select drillholes.
Selecting drillholes in the project explorer 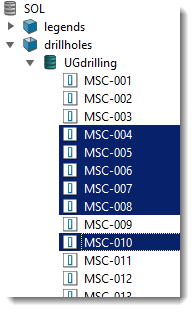
- Shift + Click defines a range
- Ctrl + Click adds/removes a single item
- Ctrl + Shift + Click adds a range
To select all drillholes in a database, click on the drillhole database
 . Hold Ctrl to select multiple databases. If multiple databases are selected, they must have the same schema.
To select a subset of drillholes, use the following controls:
-
Click on a drillhole item
to start the subset selection. -
Hold Shift and click on a drillhole item
to select the range of items from the last clicked item. -
Hold Ctrl and click on a drillhole item
to add or remove that item from the selection. -
Hold Ctrl + Shift and click on a drillhole item to add the range of items from the last clicked item to the selection.
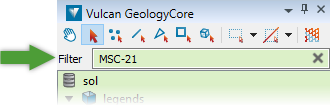
Tip: Type into the Filter field at the top of the project explorer to display only objects matching the given string.
Selecting drillholes in the view window 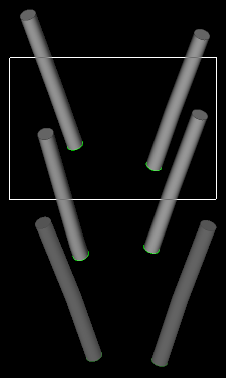
- Shift + Click adds drillholes
- Ctrl + Click removes drillholes
To select all drillholes in the view, press Ctrl + A.
To select a subset of drillholes, use the following controls:
-
In the selection toolbar located at the top of the project explorer, make sure the selection mode is set to objects
 . If selecting a region, choose Rectangle
  , Polygonal Lasso
 or Freehand
  Selection Mode.
 -
Hold Shift and draw a region to add multiple drillholes within a region.
-
Hold Ctrl and draw a region to remove multiple drillholes within a region.
-
Hold Shift and click on a drillhole to add a single drillhole.
-
Hold Ctrl and click on a drillhole to remove a single drillhole.
-
Open the Drillhole Visualisation tool. There are several ways to do this:
-
On the ribbon, go to Modelling, DomainMCF or Stratigraphic > Drillholes >
 Visualisation.
 -
On the ribbon, go to Home > Legends >
Visualisation. -
If you want to change the visualisation of a single drillhole, right-click on the drillhole in the view window and select Appearance >
Visualisation... from the context menu.
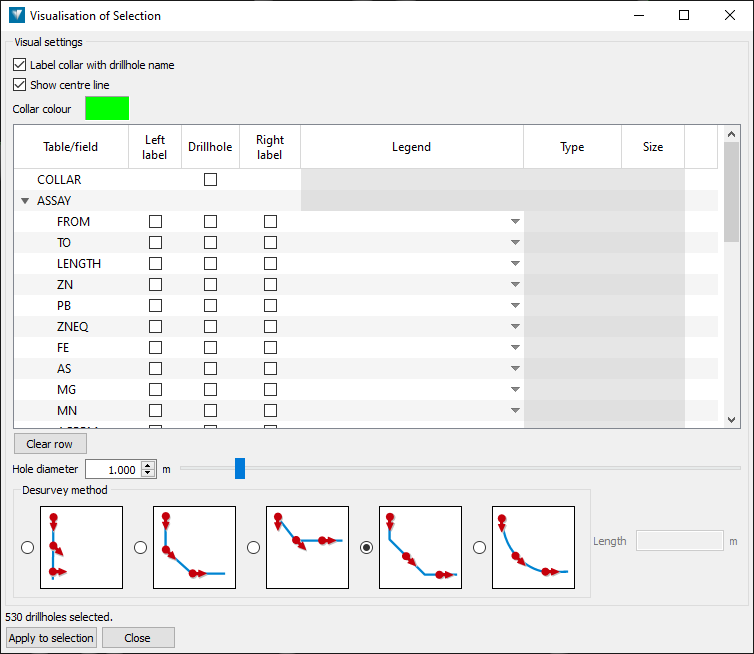
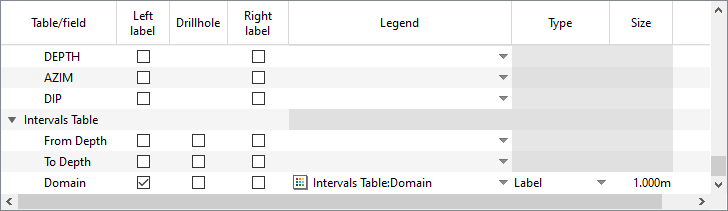
A panel similar to the one below appears.
-
-
Select the field to visualise as the drillhole (cylindrical intervals). Only one field can be set as the drillhole.
-
Find the field in the table, and select the checkbox in the Drillhole column next to it.
-
Select a legend

 to colour the drillhole intervals by from the drop-down list in the Legend column.
Vulcan GeologyCore will attempt to locate an existing legend for the field. If you leave this item blank, Vulcan GeologyCore will create a legend for you. -
Optionally change Hole diameter to set the 3D appearance of the drillholes. Setting this to 0 will result in the drillholes being displayed with a line.
-
-
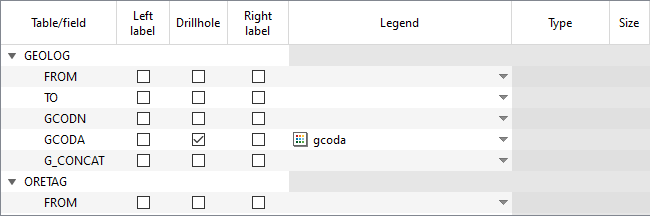
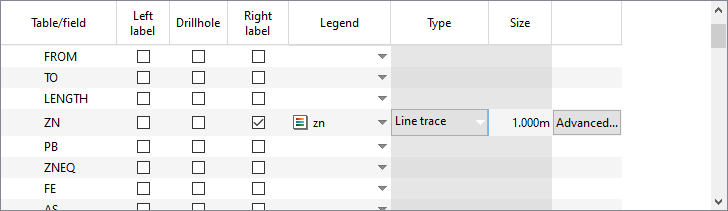
Optionally select any number of fields to display as left or right labels.
-
For each field you wish to display, select the checkbox in either the Left label or Right label columns.
-
Select a legend
to colour the labels with from the drop-down list in the Legend column.
Vulcan GeologyCore will attempt to locate an existing legend for the field. If you leave this item blank, Vulcan GeologyCore will create a legend for you. -
Select the visualisation type for the label from the drop-down list in the Type column.
-
If the field type is text or integer, select from Label, Flag, or Flag and label.
-
If the field type is decimal, select from Label, Solid trace, or Line trace.
-
-
Set the size for the label in the Size column. If the visualisation type is Label, this will be the vertical height of the labels. For other types, this will set the maximum offset distance of the label from the drillhole.
If multiple fields are set as left or right labels, they will be offset from the drillhole in the order they appear in the visualisation table.
-
-
Under Desurvey method, optionally change how downhole survey measurements are to be interpreted. The default and recommended desurvey method is Tangent.

No desurvey
Survey measurements are not applied. Each drillhole interval is positioned vertically.
“Segment following” method
Each drillhole interval following a survey measurement is positioned using that measurement.
“Segment preceding” method
Each drillhole interval preceding a survey measurement is positioned using that measurement.
“Tangent” method (default)
Each drillhole interval about a survey measurement is positioned using that measurement as a tangent.
“Tangent with given length” method
Interpolate additional survey measurements at a given distance down the hole. Each drillhole interval about a survey measurement is then positioned using that measurement as a tangent. -
Click Apply to selection to apply the current settings to the selected drillholes.
You can continue to change the settings described above, and click Apply to selection to see the result in the view window.