Cell Maps
The following table describes the tools in the Cell Maps section of the Geotechnical tab.
| Tool | Description |
| Create Cell | Creates a high level cell object for grouping cell runs. |
| Create Cell Run | Creates a sequence of cells based on toe and crest lines. |
| Assign to Cells | Associates discontinuities with superimposed cells. |
| Create Mean Discontinuity | Replaces a discontinuity set with a single average representation. |
| Set Face Mean Orientation | Calculates cell face mean orientation based on associated surface segment. |
| Set Minimum Dip | Sets the minimum dip for a cell manually, by selecting points on the associated surface segment. |
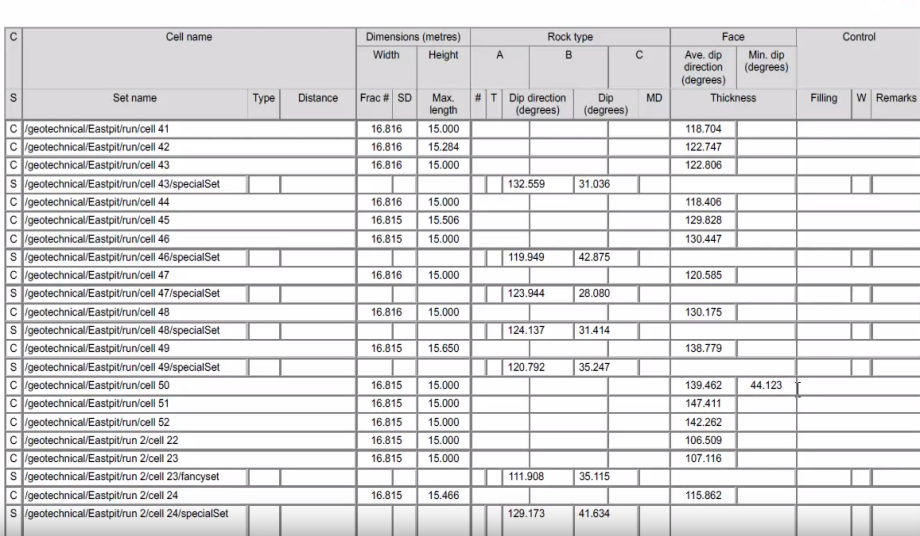
| Report | Produces a report detailing various characteristics about each cell. |
Create Cell
The Create cell tool will create a single cell object which can contain a number of selected cell runs. This cell object can be used to group cell runs of a specific pit or area. The cell can be combined with other pit and wall features for other cell mapping functions.
To create a cell:
- Select Geotechnical
> Cell Maps > Create cell.
A new empty cell will be created. - Select all cell runs to be grouped into the new cell.
- Drag (middle drag) onto the new cell object. The cell runs will be placed inside the new cell object.
- Rename the new cell if desired - usually to a name representative of the particular group of cell runs.
Creating a new cell named 'Eastpit'.

All cell runs selected and placed inside the new cell object 'Eastpit'.
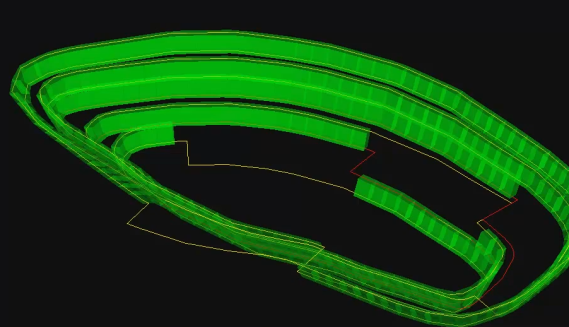
Right clicking on appropriate objects can bring up cell functions such as:
- New cell — Same as Create cell (see above)
- Cell > Show geometry — Show selected cell(s)
- Cell > Hide geometry — Hide selectedcell(s)
Create Cell Run
Create cell run builds a series of cells along a crest line and associated toe line. These cell runs can be used in analyses which focus on specific areas or groups of cells.
You will need to have lines representing the design toes and crests of the pit.
Results are saved into the destination container as a cell run object.
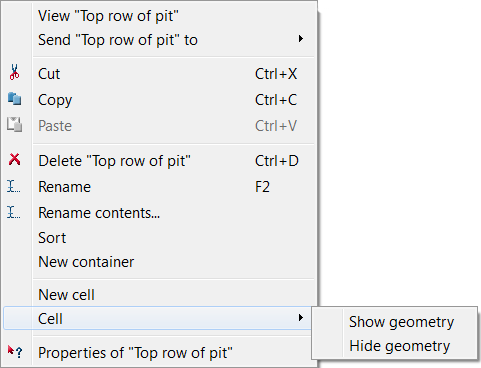
- Open the Create cell run tool: Geotechnical > Cell Maps > Create cell run.
- Middle click and drag the design toe line (line object or polygon object) to the Toe line field, or type in the name.
- Middle
click and drag the design crest line (line object or polygon object)
to the Crest line field, or
type in the name.
The run will be populated with green translucent boxes representing the cells. Numbers will be displayed indicating the cell numbers. The initial layout will use default or previous values. - You
can choose to customise the cell layout by adjusting the following
optional settings. Cell visualisation will update in real time.
- Click along the cell run to select a specific Start point and/or End point if desired. Alternatively enter coordinates manually.
- Change Run name and/or Cell name if desired.
- Change Starting cell number if desired.
- Choose whether to Reverse run direction numbering of cells.
- Choose whether to Swap the start and end points of the numbering sequence on the cells.
- Cell dimensions:
- Adjust cell width and depth.
- Restrict cell size. Choose whether cells will be created between the crest and toe line if they are larger than the cell width and depth multiplied by the Maximum size factor.
- Enter a value for the Maximum size factor.
- Select destination for the cell run. Default container is geotechnical.
- Click Apply or OK to complete.
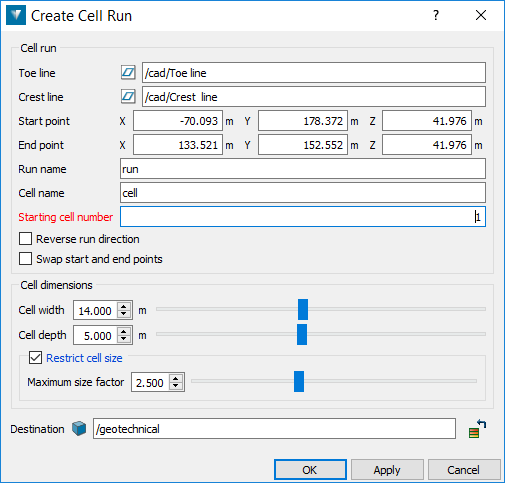
Cell run created using top toe and crest lines in a pit configuration.
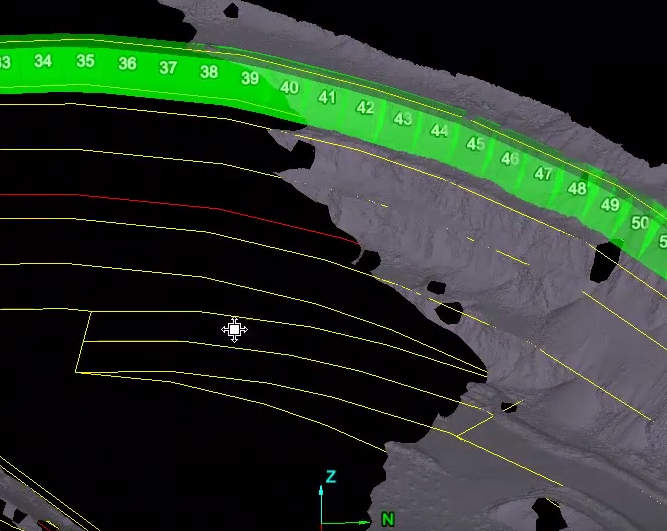
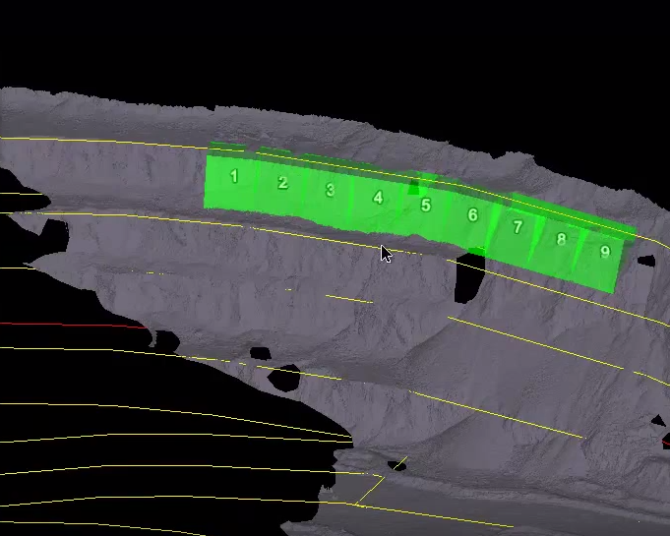
Cell run with start and end point selected as shown.
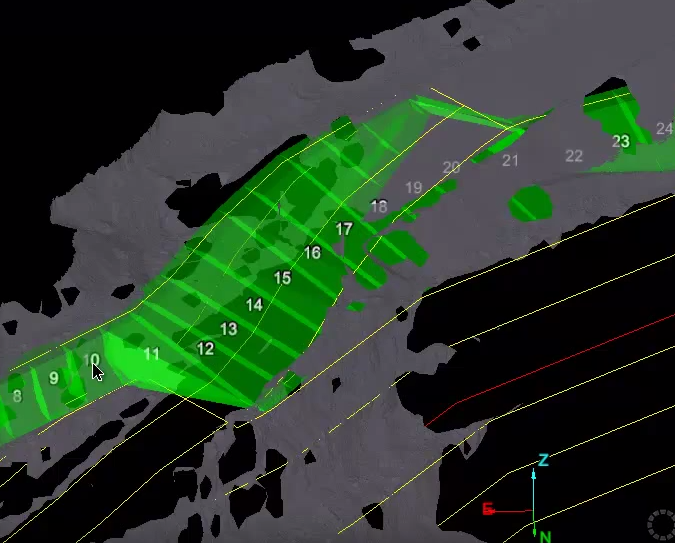
Cell run which does not restrict cell size, otherwise longer cells (cells 10, 11, 12, etc.) would not be created.
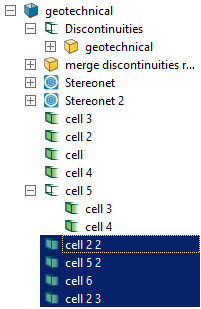
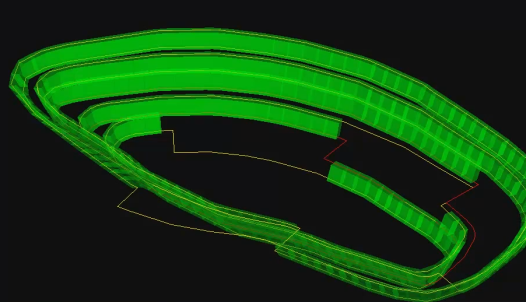
Four cell runs organised under one main cell object for a pit.
Assign to Cells
Discontinuities are assigned to cells that contain them when superimposed in 3D space. The result is that individual discontinuities appearing within a cell will be either copied or moved to the cell object itself.
- Select the discontinuities and/or discontinuity sets to be assigned.
- Select
Geotechnical > Cell Maps >
Assign to Cells.This will open a new panel.
- Middle
click and drag all relevant cells and cell runs to the cell map field.
Alternatively, select and click the plus symbol, or use the minus
symbol to remove selections.
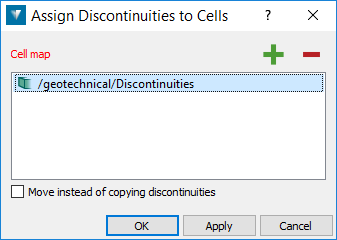
- Check theMove instead of copying discontinuities checkbox if desired. Otherwise, discontinuities will be copied into cells.
- Click OK or Apply to complete. Discontinuities will be assigned to their equivalent cells and will be visible in the View Window display.
Discontinuities may still be readily manipulated and moved around as desired - even into different cells.
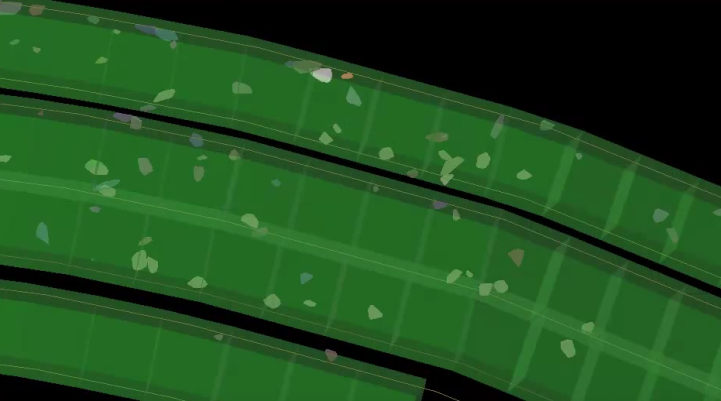
Here is a close up view of discontinuities sitting inside cells.
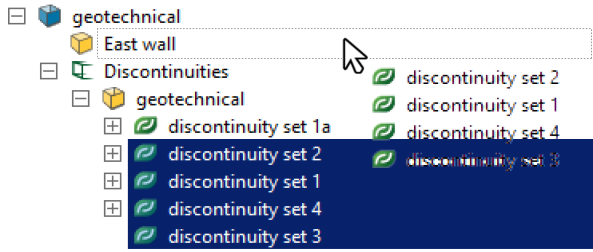
An alternative method is to select and drag all discontinuities onto main cell object.
Create Mean Discontinuity
Create mean discontinuity will create a single discontinuity representing the mean orientation of a selected discontinuity set. The new mean discontinuity will be placed in the geotechnical container.
Multiple discontinuity sets may be selected and processed at once. All other (individual) discontinuities, if selected, will be ignored. Cell arrangements will be ignored.
This function allows the user to select and group closely packed discontinuities into discontinuity sets and then replace them with a single (average) discontinuity. This results in a more evenly distributed representation of discontinuities, particularly for the purpose of kinematic analyses with stereonets. Otherwise, closely clumped discontinuities may produce undesired bias.
- Select discontinuity sets to be averaged. If a selection contains other individual discontinuities and grouping in cells, these are ignored.
- Select Geotechnical > Cell Maps > Create Mean Discontinuity.
- Select OK or Apply to complete.
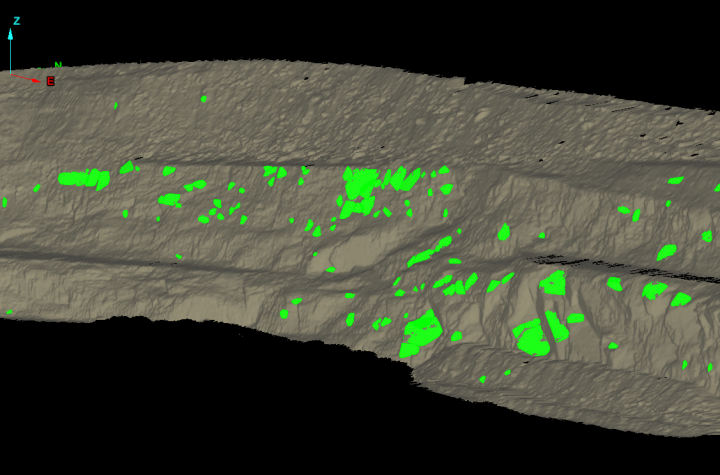
Here is an initial distribution of discontinuities.
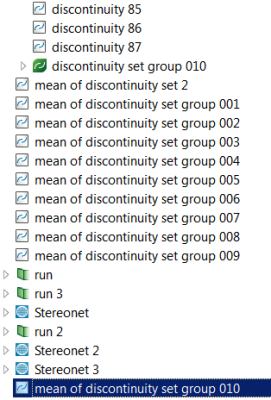
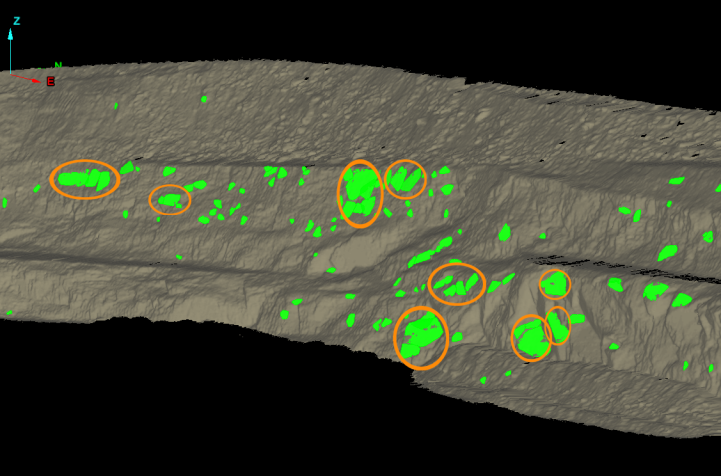
Discontinuities to be grouped together are moved into discontinuity sets.
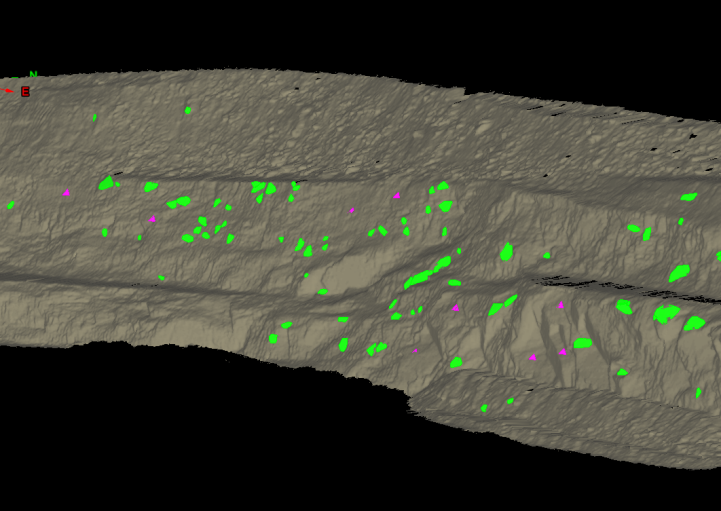
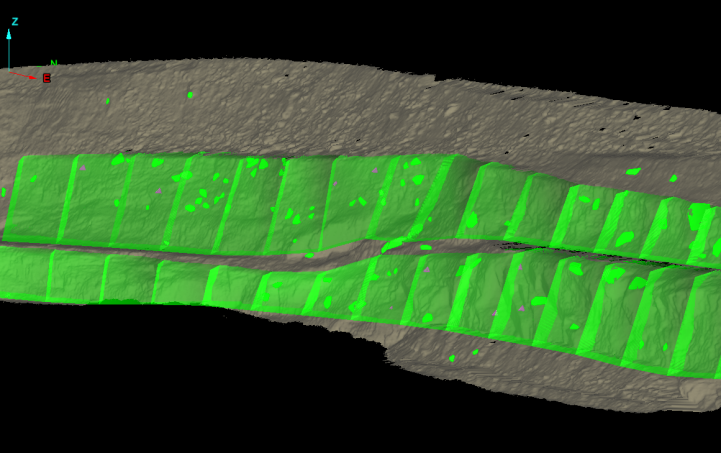
Result after discontinuity sets have been replaced with a mean discontinuity object (pink triangles).
Initial example above - shown in cell runs.
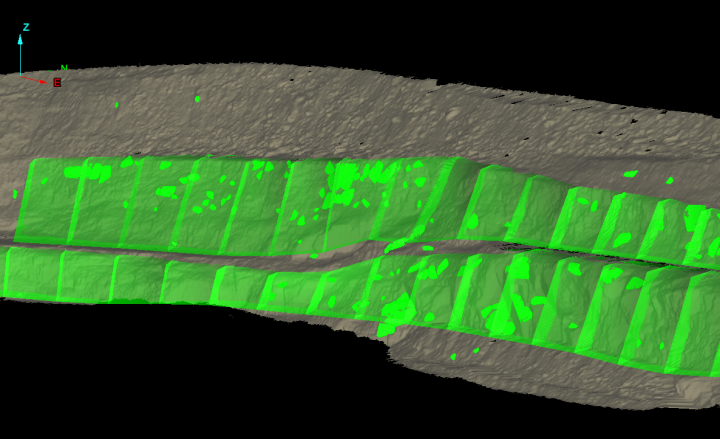
Result, as above, after creating mean discontinuities to replace discontinuity sets - note that results are independent of cell runs.
Set Face Mean Orientation
This function uses the section of pit face or wall contained within a cell to calculate a mean face orientation. The mean orientation value is then assigned to the cell. This quantity and others can be retrieved using the Cell Map Report function.
The results are viewable in the report window.
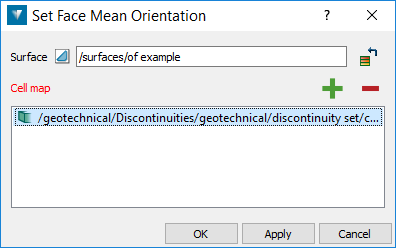
- Select Geotechnical > Cell Maps > Calculate cell face mean orientation.
- Select surface to calculate cell face mean orientation. Clicking object should auto-fill Surface field. Otherwise type in name.
- Add cells and cell runs to the cell map field by selecting and clicking the plus symbol. Use the minus symbol to remove the entry. Alternatively, cells may be dragged and dropped into the field box.
- Click OK or Apply to carry out the process.
Set Minimum Dip
Allows the user to set a minimum dip value for a cell. The user enters values or selects three points on the pit wall or surface that represent the plane of the minimum dip value. This quantity and others can be retrieved using the Cell Map Report function.
- Select the cell to be assigned a minimum dip value.
- Select Geotechnical > Cell Maps > Set Minimum Dip. (Alternatively right click on the cell and select Cell > Set Minimum Dip. )
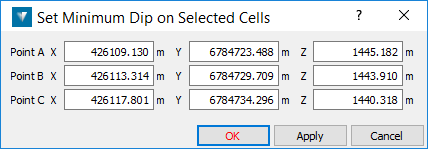
- A panel will open with fields for the coordinates of three points. Enter values or select each field and click on the part of the pit surface you want to use to define the plane of minimum dip. You may also right click the cell and go to Cell > Hide Geometry to assist the process of clicking on pit surface points.
- Click OK or Apply to complete.
Select cell to set minimum dip.
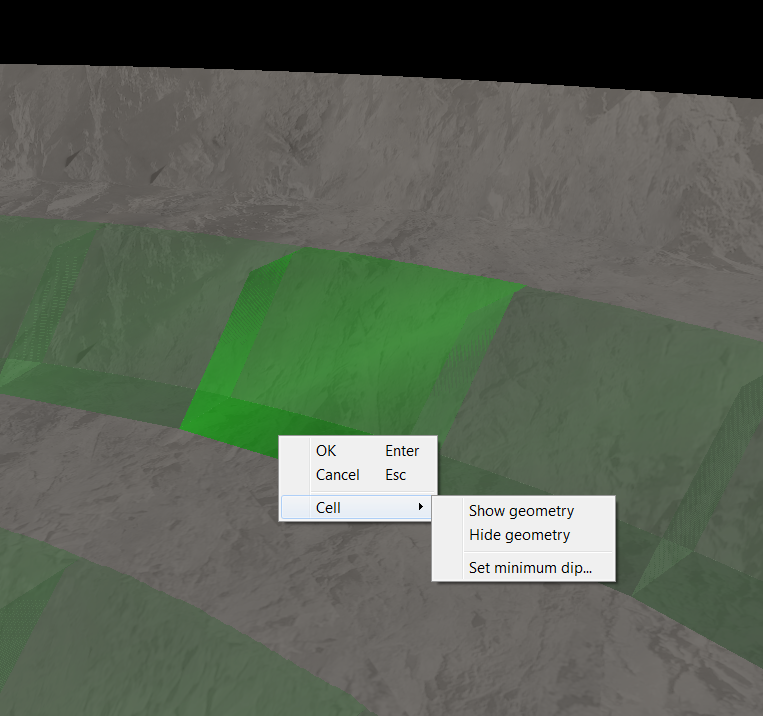
Hide geometry of the cell so that the surface can be clicked on.
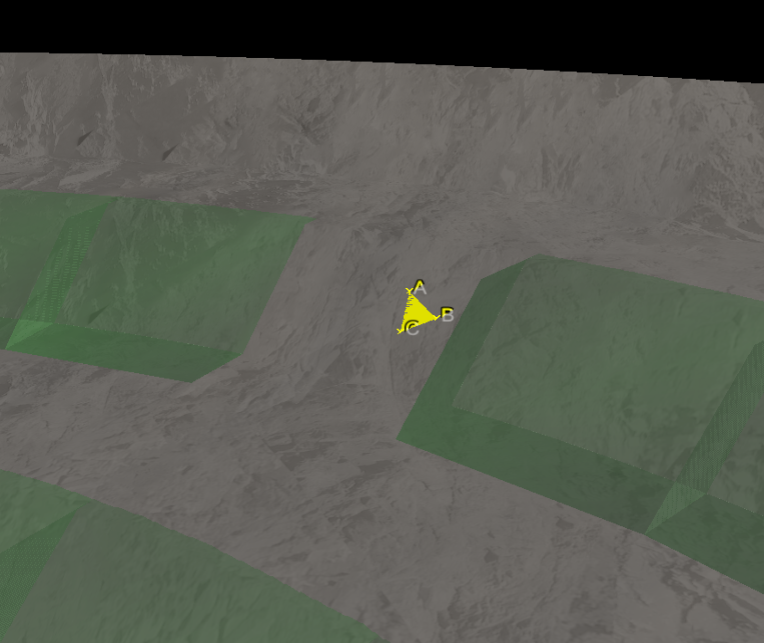
Click three points (or enter coordinates) creating a plane to define the minimum dip.
Results are
displayed in the report window.
The minimum dip is also included
in a Cell Map Report

Report
Cell map report produces a report detailing various important characteristics of the selected cells.
- Select the cells to be included in the report.
- Select Geotechnical > Cell Maps > Report.
- You can write out the data to a text file or PDF document. The PDF will also allow the inclusion of a cell map image. If you untick the Write report to file checkbox, the report will be displayed in the report window only.
- Click
OK or Apply
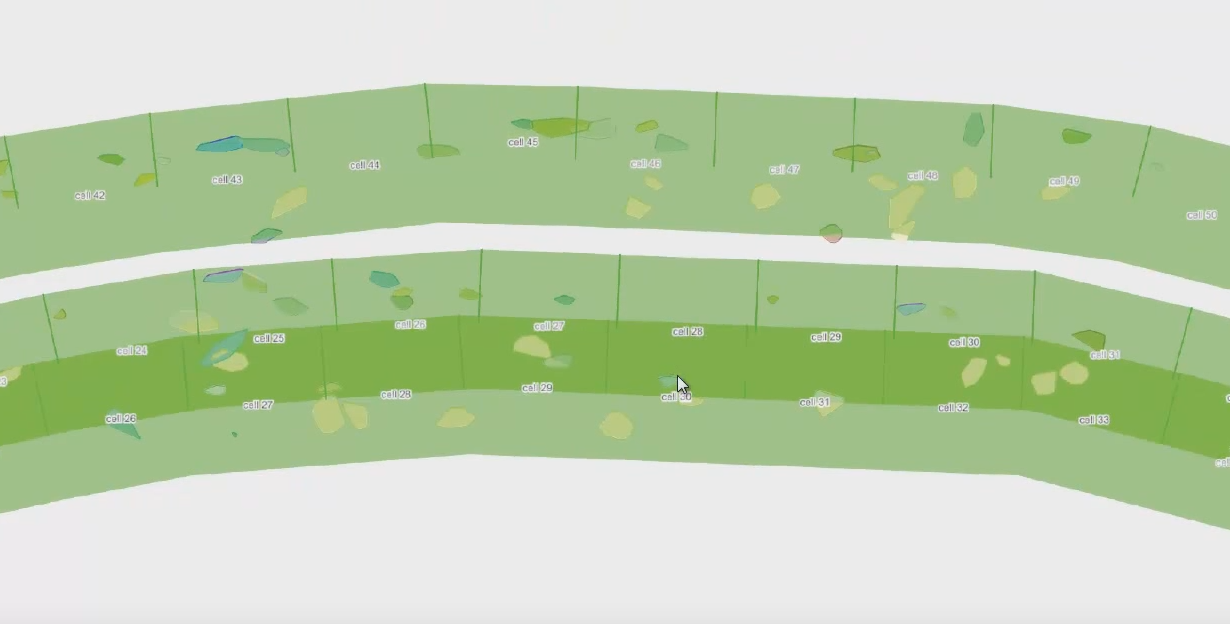
to commence generating the report. The report will contain the cell map image (if selected) and
a table listing characteristics
of each cell that has been selected.
If the cell map report transaction is launched with a view window active, the PDF report image will be generated using the viewpoint of the active view, including any other objects present in the view, otherwise by default it will show just the cell map selection in plan view.
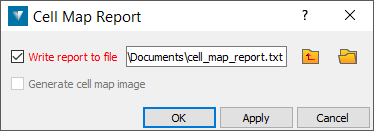
Cell map image is an option for including in the report.
The table in the Cell map report, listing various characteristics about each cell.
