Report
The Report group of the Pre-Charging ribbon contains tools to generate reports on different pre-charging processes.
 Water Report
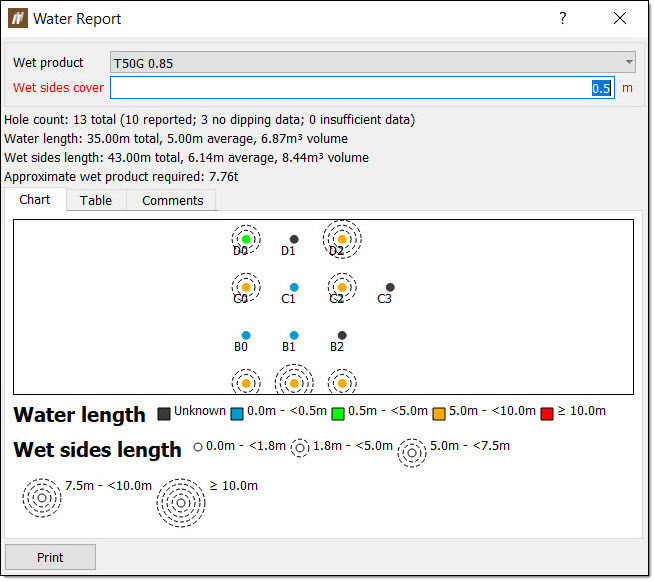
The Water Report tool summarises the water content per hole selected. You can use this information to identify the water distribution within the selected holes and estimate the amount of wet product required for the blast operation.
To generate a water report, follow these steps:
-
Select the desired holes in the view window or data explorer
-
On the Pre-Charging ribbon, in the Report group, select Water Report. The Water Report panel will appear.
-
Select the desired product from the Wet product drop-down.
-
Enter the wet sides cover into the Wet sides cover field.
-
Browse the report tabs. The report displays data differently in three separate tabs:
-
Chart — BlastLogic displays a plot of the holes in the Chart tab. You can interact with the plot in the following ways:
-
Zoom into sections of the plot by drawing a box around the desired area. Zoom out by right clicking anywhere on the plot.
-
Double click on a hole in the plot to display the hole properties panel for that hole.
-
-
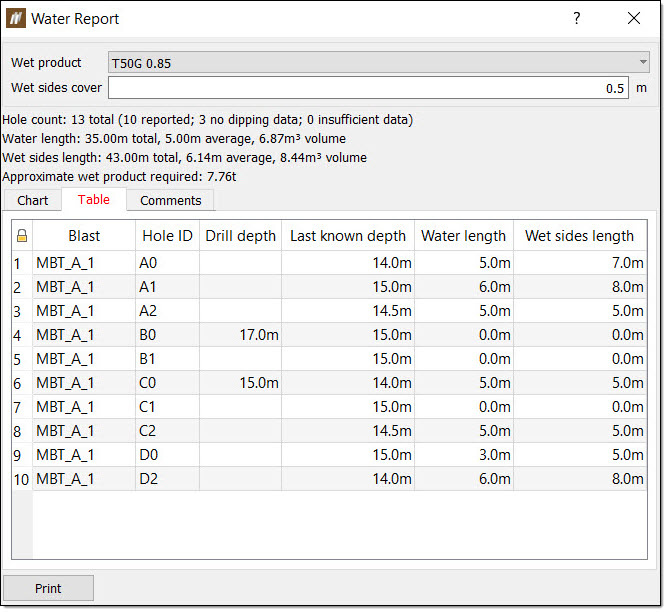
Table — The Table tab shows a table summary of the water data. BlastLogic indicates abandoned holes with a strike through the text.
-
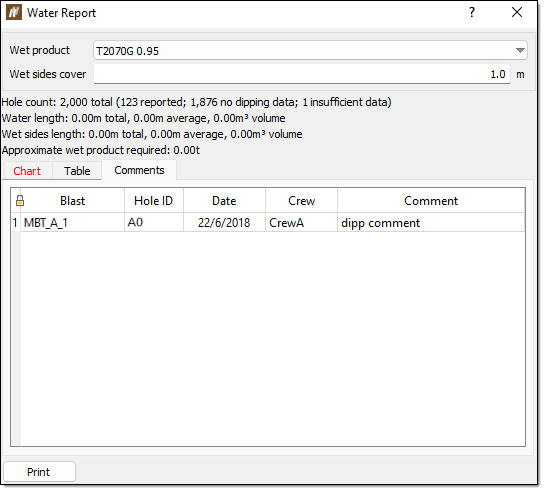
Comments — BlastLogic displays any comments entered with the water data in the Comments tab.
-
 Pattern Condition Report
The Pattern Condition Report tool compares the design charge depth to the actual depth. We recommend using this report tool after the dipping process has taken place but before backfilling and charging is performed. This because this report aids you in determining the following: number of holes that require the following:
-
The number of holes that were drilled within tolerance
-
The number of holes that require re-drilling or backfilling
To generate a pattern condition report, follow these steps:
-
Select the desired holes in the view window or data explorer.
-
On the Pre-Charging ribbon, in the Report group, select Pattern Condition Report.
The Pattern Condition Report panel will appear.
-
Browse the report tabs. The report displays data differently in three separate tabs:
-
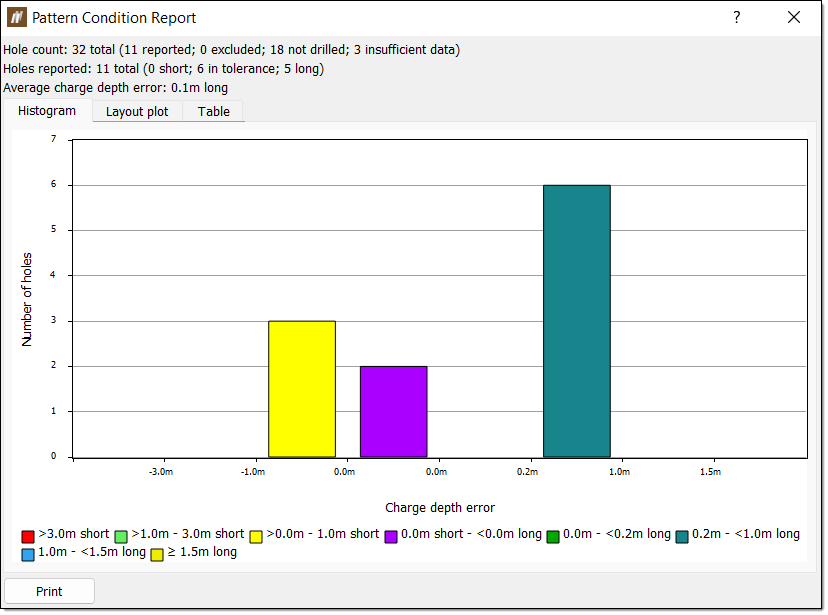
Histogram — The Histogram tab displays a histogram of the number of holes against the drill depth error. You can interact with the histogram in the following ways:
-
Hover over a bar to display the number of holes in the bar and the specific range of the bar.
-
Double click a bar to open the hole tabular view associated with the holes in the bar.
-
-
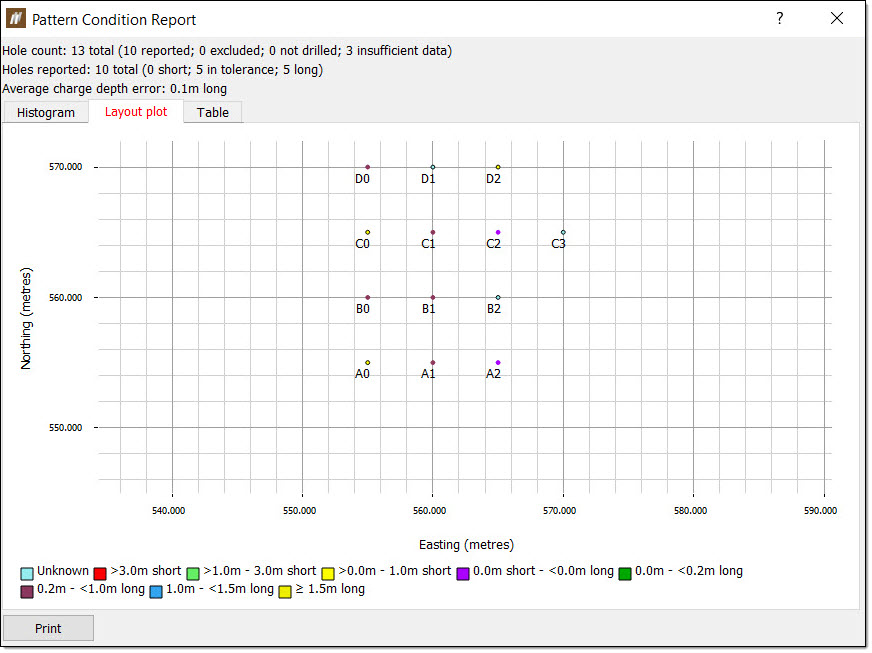
Layout plot — BlastLogic displays a plot of the holes in the Layout plot tab. The holes are colour coded based on their respective charge depth error. You can interact with the plot in the following ways:
-
Zoom into sections of the plot by drawing a box around the desired area. Zoom out by right clicking anywhere on the plot.
-
Double click on a hole in the plot to display the hole properties panel for that hole.
-
-
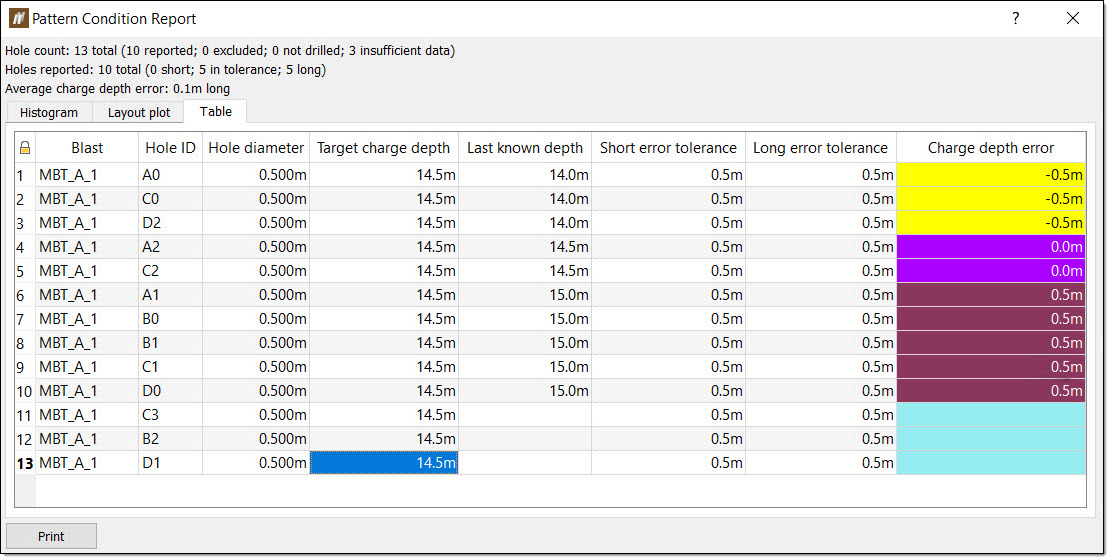
Table — The Table tab shows a table summary of the hole data. BlastLogic indicates abandoned holes with a strike through the text.
 Note:
Note:BlastLogic colours the Charge depth error column cells according to the settings in the report setup tab of the site tool panel. You can open this panel by navigating to the Home ribbon and selecting Site from the Setup group. For more information on changing these colours, refer to the Report setup section on the setup page.

-
 Time-Dependent Fallback Report
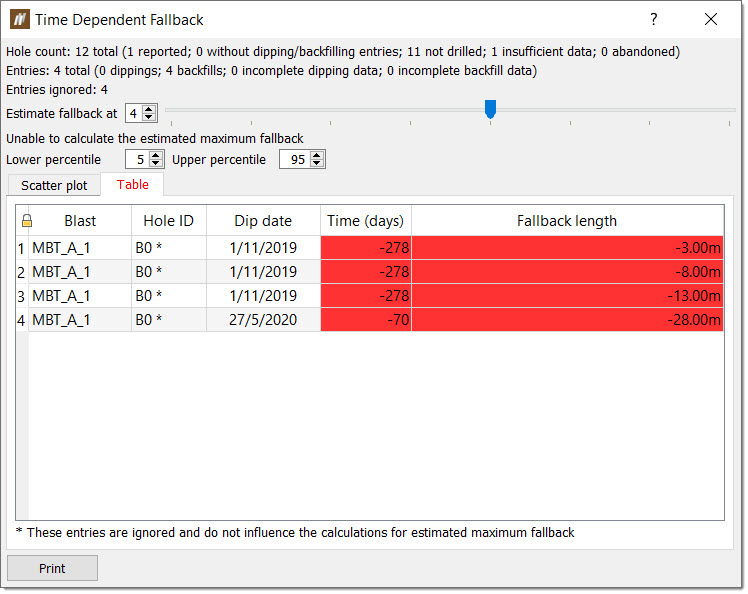
The Time-Dependent Fallback Report tool predicts the fallback speed of drill cuttings between drilling completion and dipping measurement.
To generate a time-dependent fallback report, follow these steps:
-
Select the desired holes in the view window or data explorer.
-
On the Pre-Charging ribbon, in the Report group, select
Time Dependent Fallback Report.The Time Dependent Fallback panel will appear.
-
Browse the report tabs. The report displays data differently in two separate tabs:
-
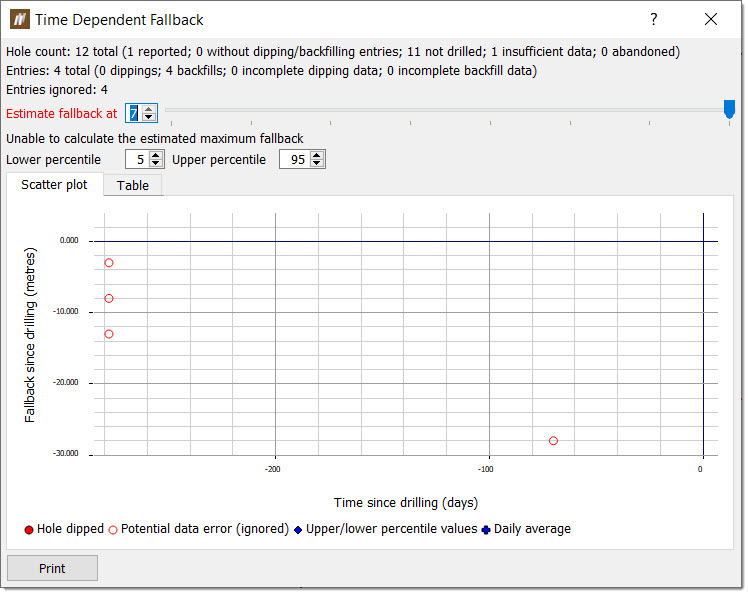
Scatter plot — The Scatter plot tab displays a plot of the fallback since drilling against the time since drilling. You can interact with the scatter plot in the following ways:
- Hover over a point to display the hole number, days since drilling and fallback.
-
Zoom into sections of the plot by drawing a box around the desired area. Zoom out by right clicking anywhere on the plot.
-
Double click on a hole in the plot to display the hole properties panel for that hole.
-
Table — The Table tab shows a table summary of the fallback data. BlastLogic indicates abandoned holes with a strike through the text.
-
 Backfill Compliance Report
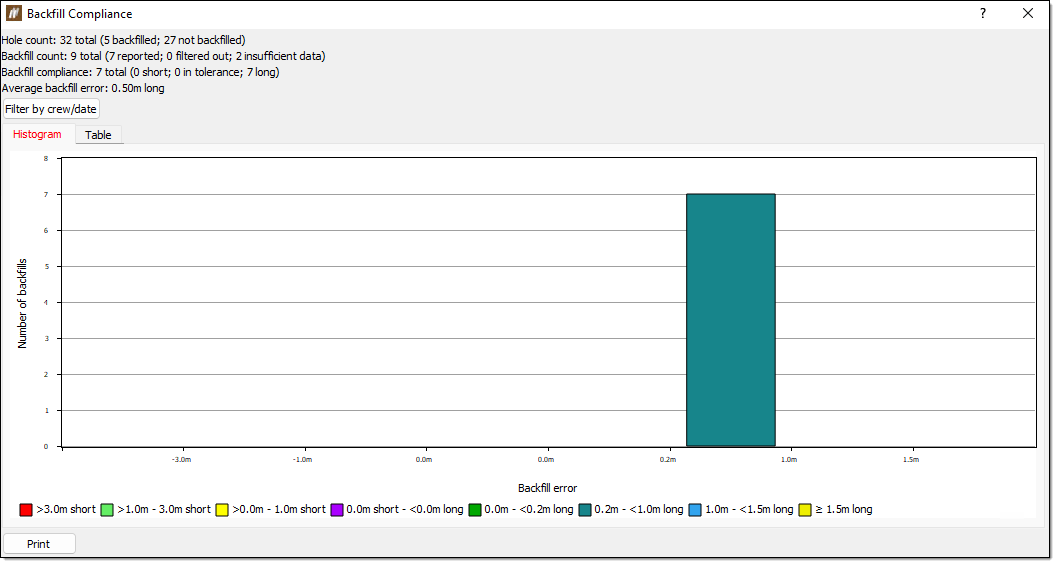
The Backfill Compliance Report tool summarises how well the holes were backfilled. If a hole has more than one backfill entry, the report considers all of the backfill entries.
To generate a backfill compliance report, follow these steps:
-
Select the desired holes in the view window or data explorer.
-
On the Pre-Charging ribbon, in the Report group, select
Backfill Compliance Report.The Backfill Compliance panel will appear.
-
Browse the report tabs. The report displays data differently in three separate tabs:
-
Histogram — The Histogram tab displays a histogram of the number of backfills against the backfill error. You can interact with the histogram in the following ways:
-
Hover over a bar to display the number of holes in the bar and the specific range of the bar.
-
Double click a bar to open the hole tabular view associated with the holes in the bar.
-
-
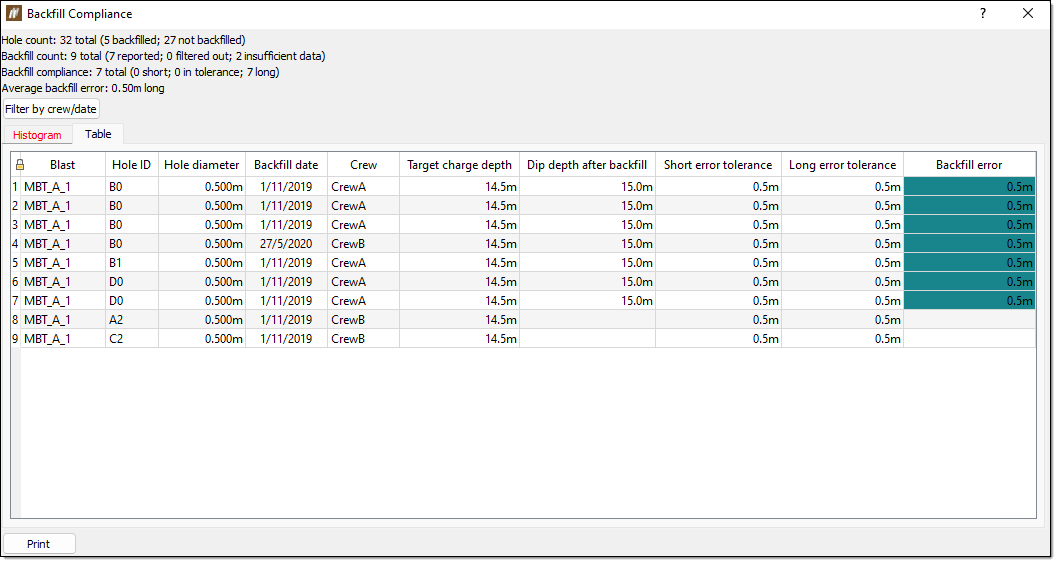
Table — The Table tab shows a table summary of the backfill data. BlastLogic indicates abandoned holes with a strike through the text.
 Note:
Note:BlastLogic colours the Backfill error column cells according to the settings in the report setup tab of the site tool panel. You can open this panel by navigating to the Home ribbon and selecting Site from the Setup group. For more information on changing these colours, refer to the Report setup section on the setup page.
The backfill colours are set by the Charge depth error colours scheme in the panel.
-
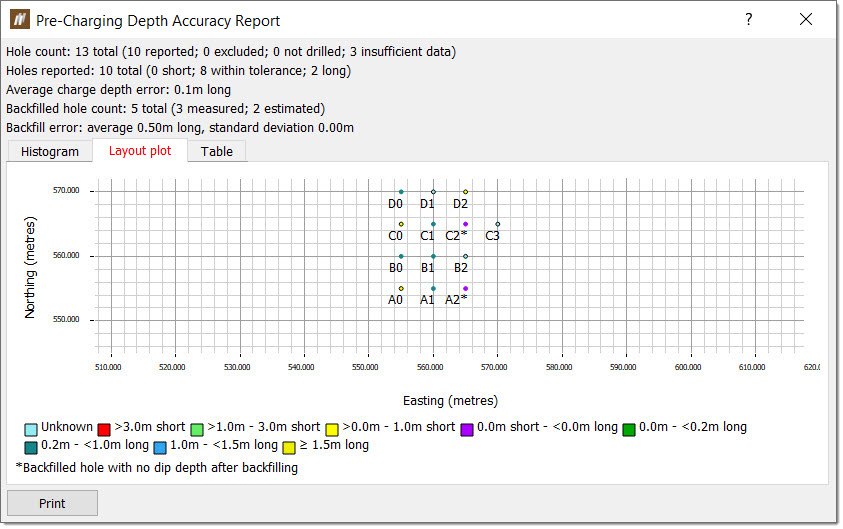
 Pre-Charging Depth Accuracy Report
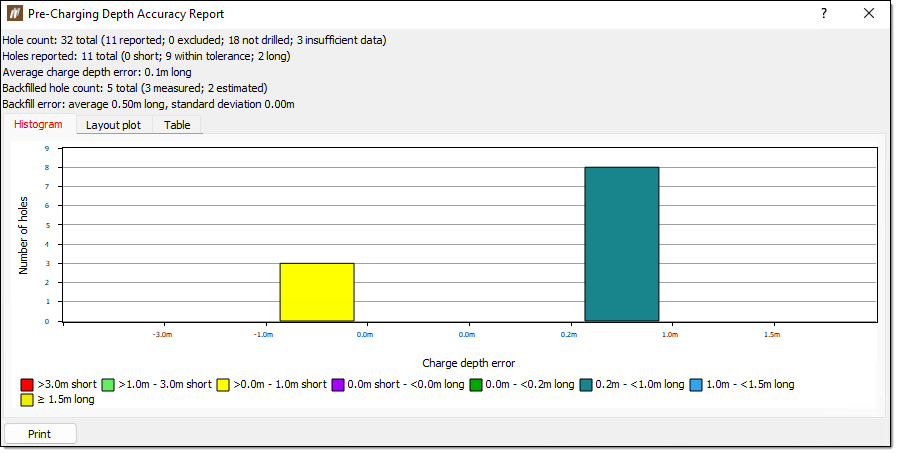
The Pre-Charging Depth Accuracy Report tool summarises the accuracy of drilling and backfilling process. We recommend you generate this report after any backfilling (which is identified by the pattern condition report) has been performed. This is because the report assumes the lengths of holes that were backfilled (without checkdip) by applying the average backfill error from other holes that were backfilled and checkdipped.
You can use this report to identify systematic errors in the drilling and backfilling process. The report can also evaluate the quality of drilling and backfilling across the blast.
To generate a pre-charging depth accuracy report, follow these steps:
-
Select the desired holes in the view window or data explorer.
-
On the Pre-Charging ribbon, in the Report group, select
Pre-Charging Depth Accuracy Report.The Pre-Charging Depth Accuracy Report panel will appear.
-
Browse the report tabs. The report displays data differently in three separate tabs:
-
Histogram — The Histogram tab displays a histogram of the number of holes against the charge depth error. You can interact with the histogram in the following ways:
-
Hover over a bar to display the number of holes in the bar and the specific range of the bar.
-
Double click a bar to open the hole tabular view associated with the holes in the bar.
-
-
Layout plot — BlastLogic displays a plot of the holes in the Layout plot tab. You can interact with the plot in the following ways:
-
Zoom into sections of the plot by drawing a box around the desired area. Zoom out by right clicking anywhere on the plot.
-
Double click on a hole in the plot to display the hole properties panel for that hole.
-
-
Table — The Table tab shows a table summary of the hole data. BlastLogic indicates abandoned holes with a strike through the text.
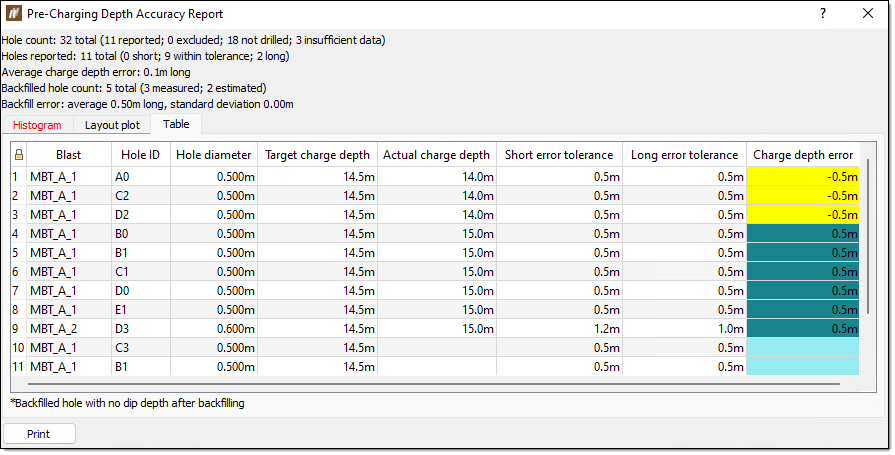 Note:
Note:BlastLogic colours the Charge depth error column cells according to the settings in the report setup tab of the site tool panel. You can open this panel by navigating to the Home ribbon and selecting Site from the Setup group. For more information on changing these colours, refer to the Report setup section on the setup page.
-
