Live Dashboard
You can analyse your results while scheduling your mine by coupling standard pivot reporting with Epoch's live dashboard.
To use the live dashboard:
-
Generate a schedule (see 4. Generate and View the Schedule).
Note:You don’t need to save the schedule to view it in the live dashboard.
-
Select the Schedule Playback tab from the Reporting Window tabs.

-
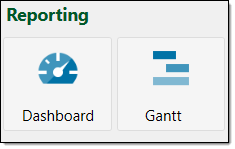
In the Schedule Playback tab, from the Reporting section, select Dashboard
 .
.
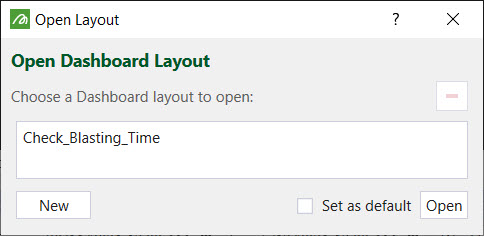
The Open Layout panel will appear.
-
Either choose an existing layout or create a new layout for the live dashboard.
-
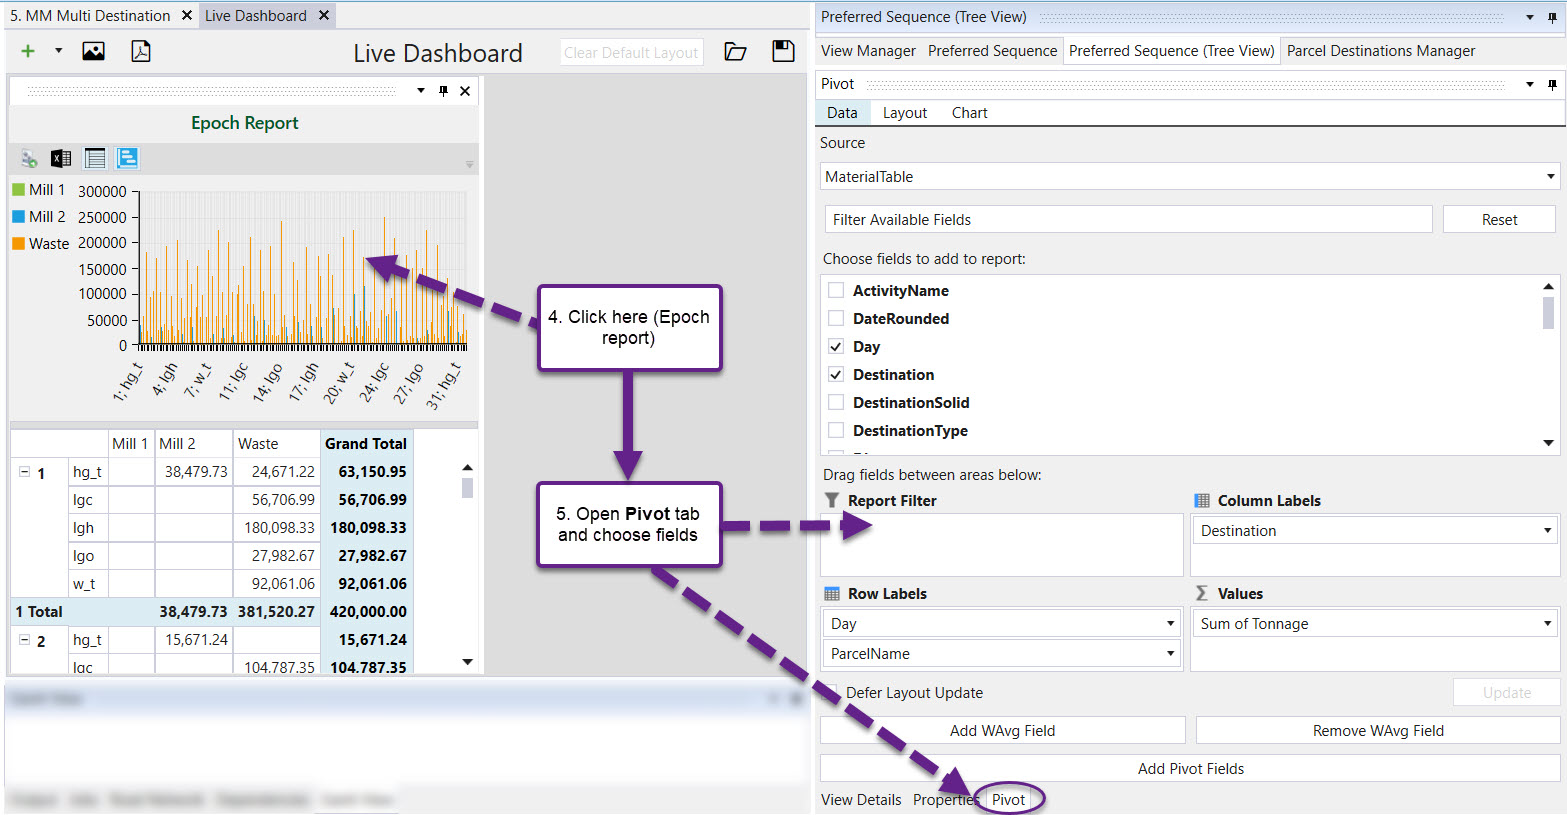
Click anywhere in the Epoch report to make it active.
-
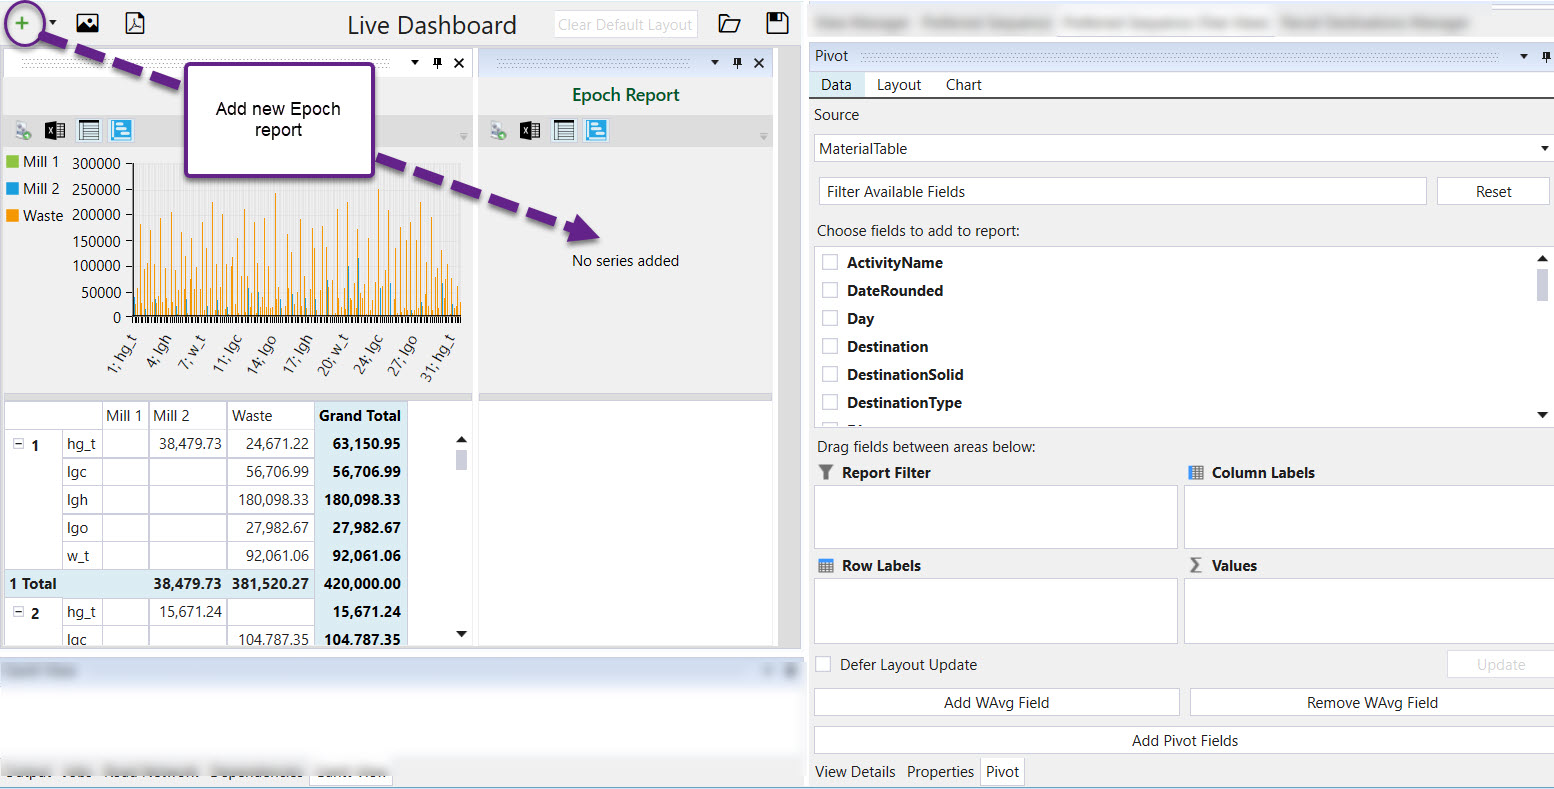
Open the Pivot report and choose the appropriate fields. Learn more about pivot reporting in the designated topic.
To add a new Epoch report, click the green plus button as shown below.
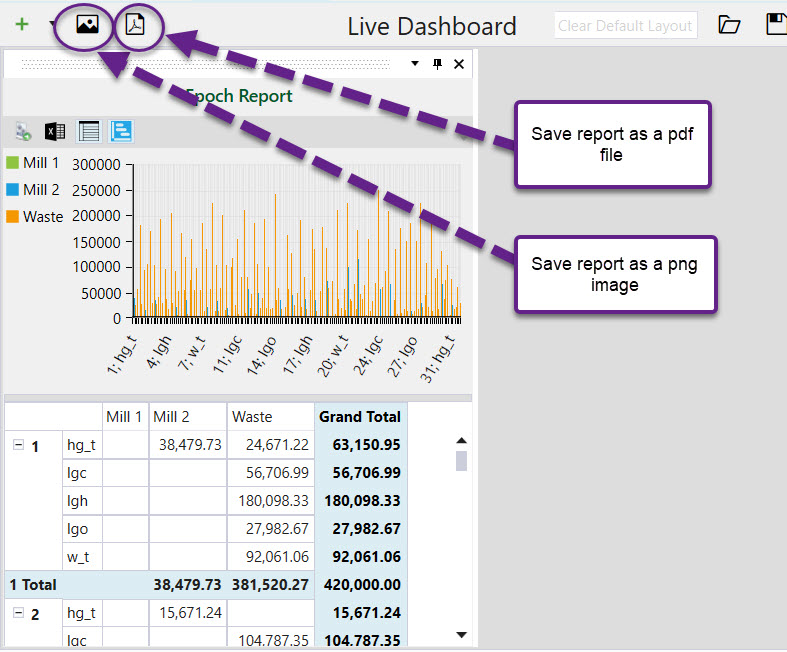
The report can also be saved as a png image or a pdf file as shown below.
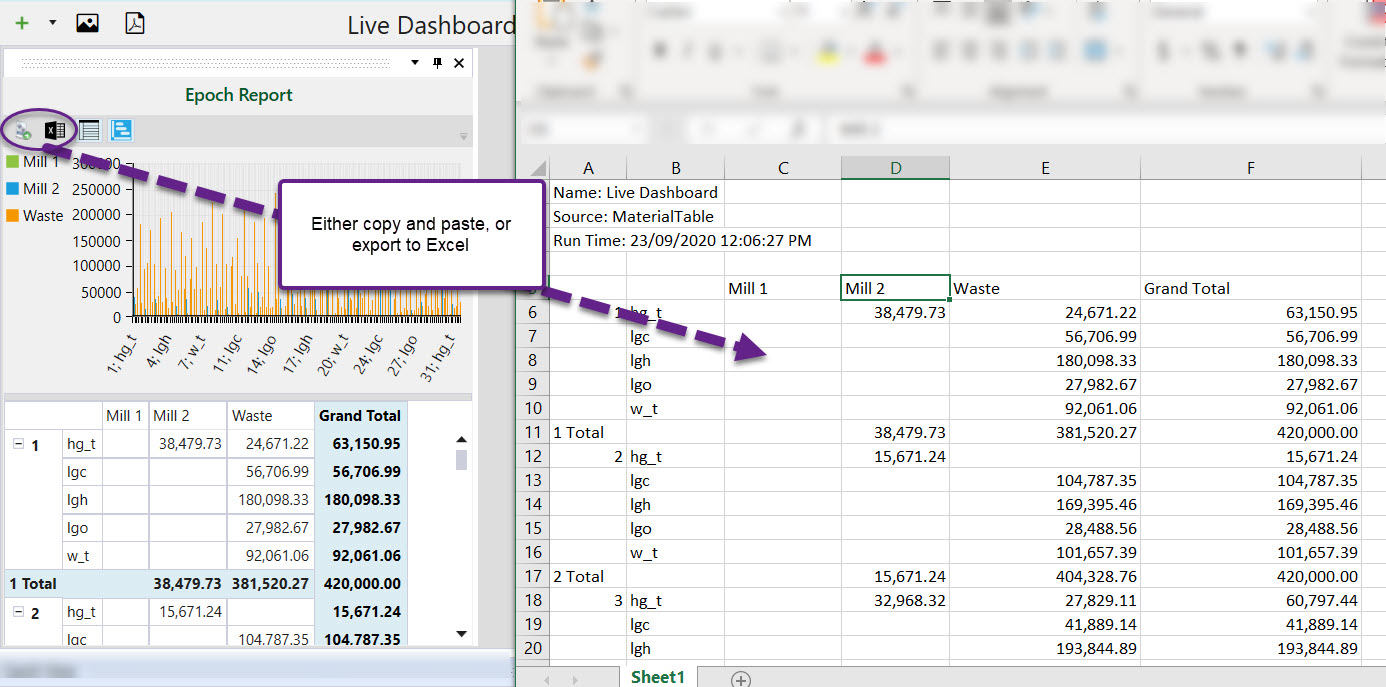
You can also export results from the Live dashboard by either copying and pasting the results into a spreadsheet or exporting the results as a separate Microsoft Excel project as shown below.
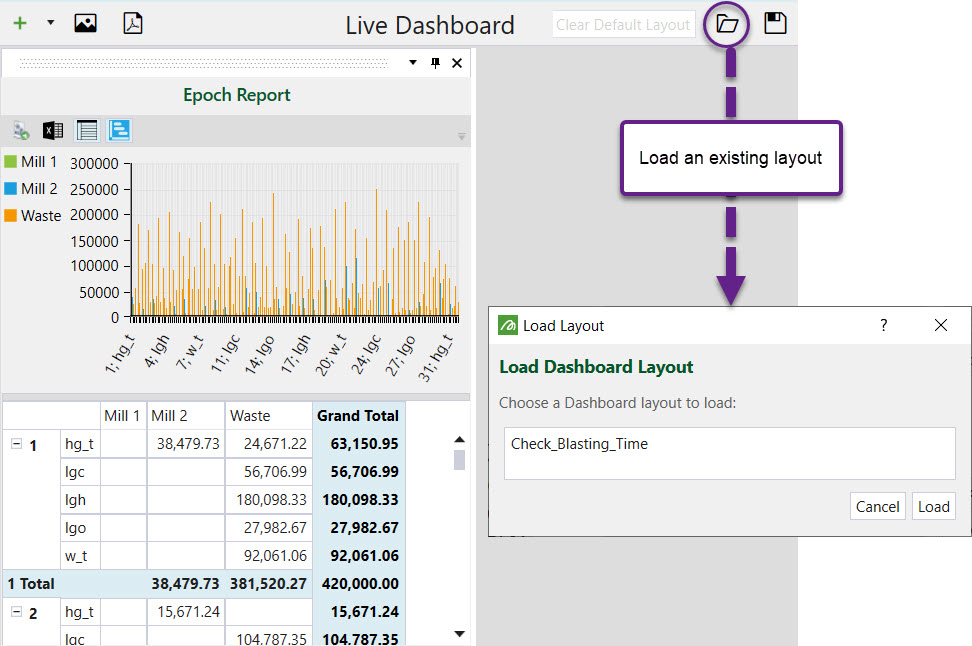
An existing layout can be loaded into the Live dashboard as shown below.
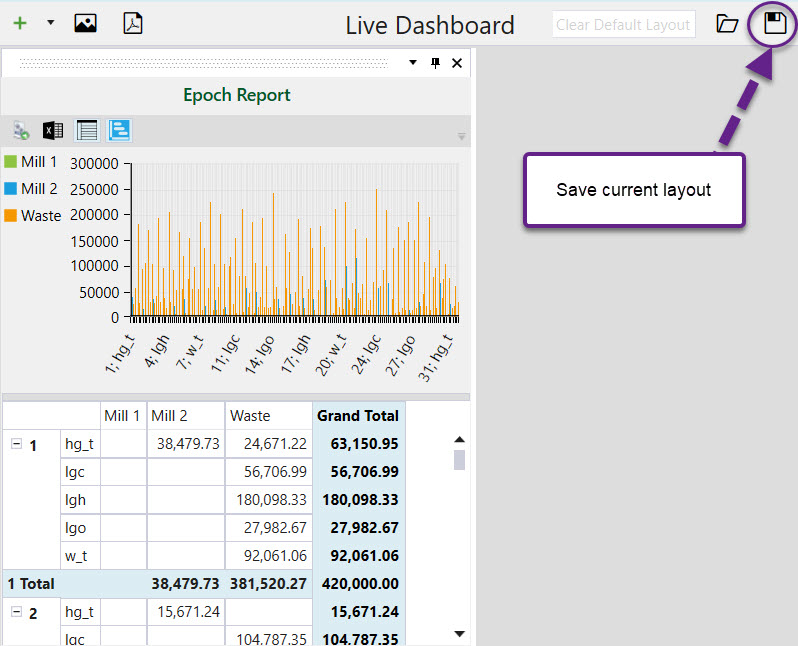
The current layout can also be saved for future use using the method below.