Pivot Reporting
Source file: howto-how-to-create-pivot-reports.htm
Once you have generated a schedule, use pivot reporting to perform further analysis.
Creating a pivot report
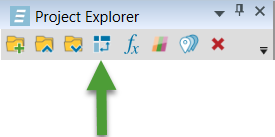
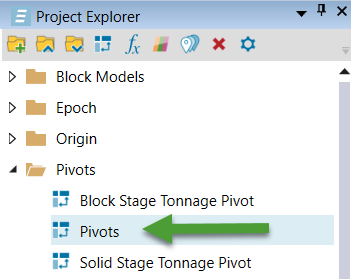
- Add a pivot report by clicking the
 icon from the project explorer toolbar.
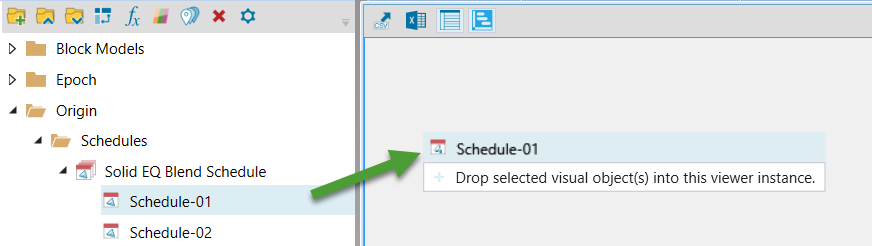
 - Drag and drop the schedule into the Workspace.
- Configure your pivot report.
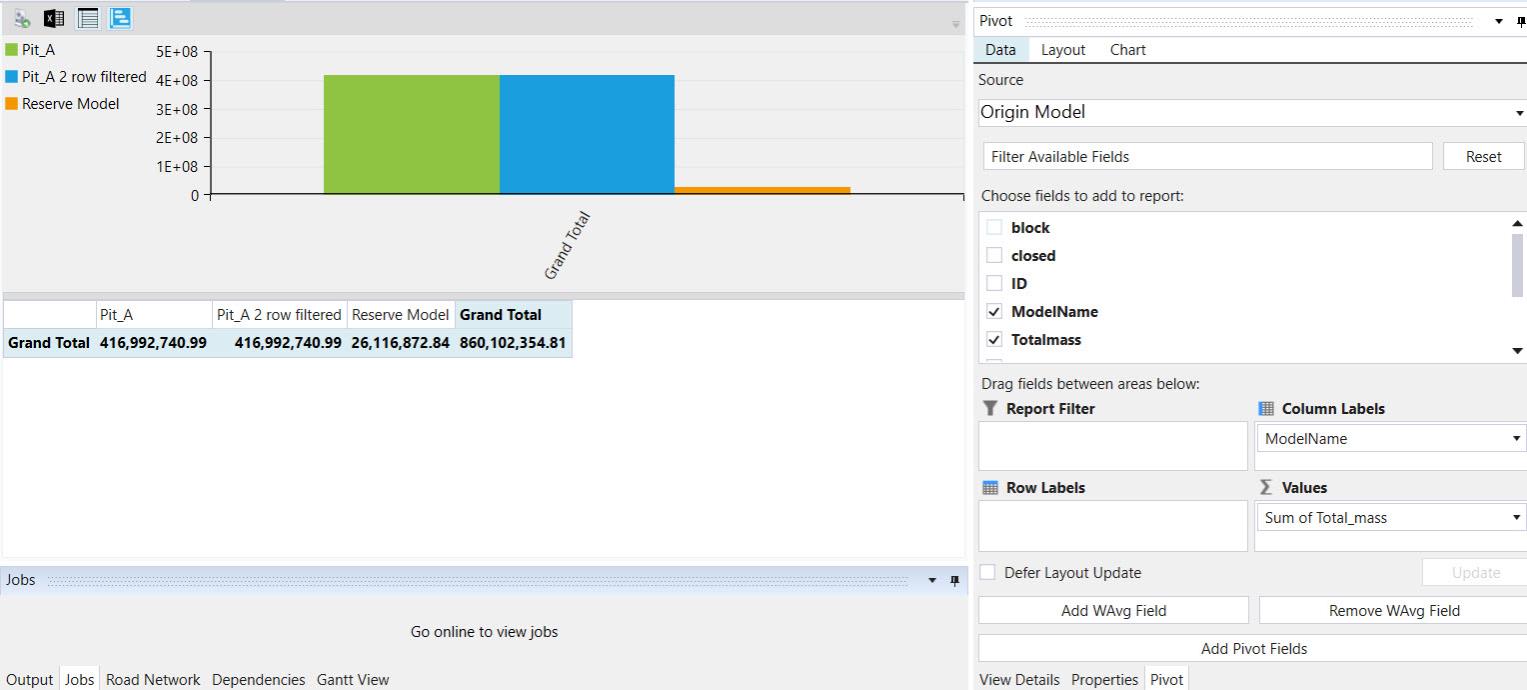
- Open the Data tab on the right of your screen.
- Set the Source to one of the following: Origin/Solids Schedule, Comprehensive Parcel Data Table or Waste Solid Table. Evolution will automatically set the source to Origin/Solids Schedule.
- Choose the fields you would like to add to your pivot report from the list by selecting the checkbox next to the field.
- Drag and drop your selected fields into the following areas:
- Report Filter— Use if only a subsection of results are relevant. For example, if you only want to know the amount of tonnes sent to the waste dump, you can filter your data by destination.
- Column Labels
- Row Labels
- ∑Values— Specify the data you want aggregated in each cell. By default, the aggregation type is set to sum.
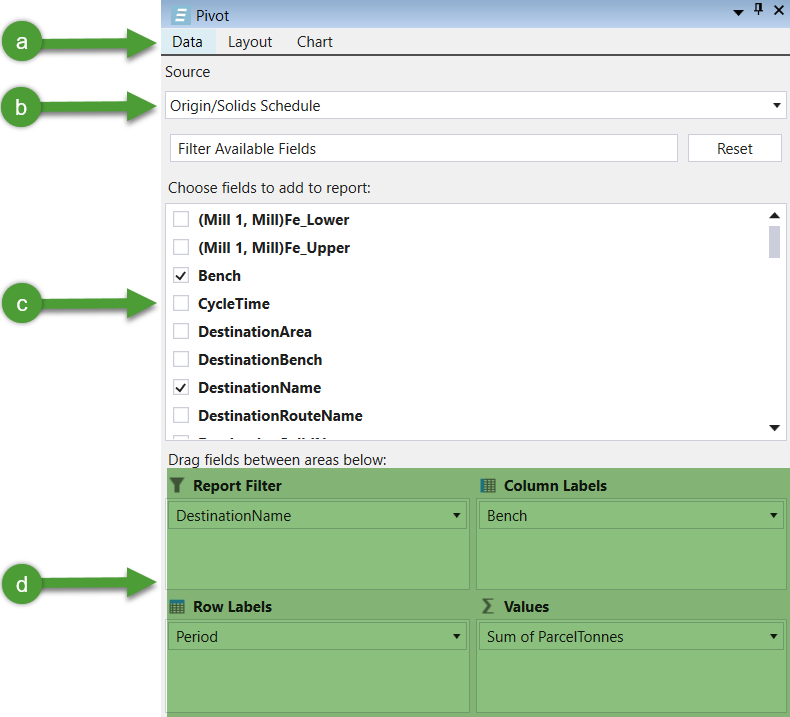
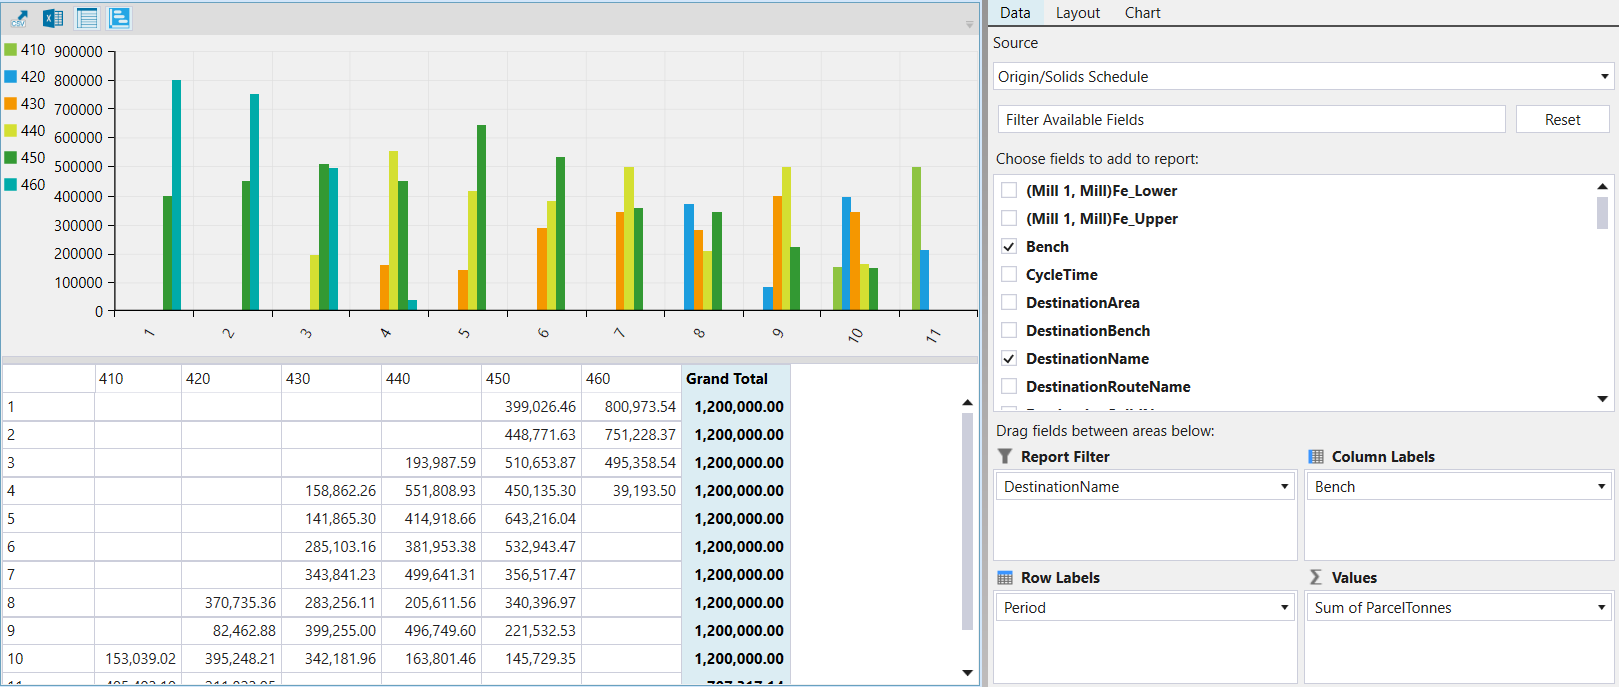
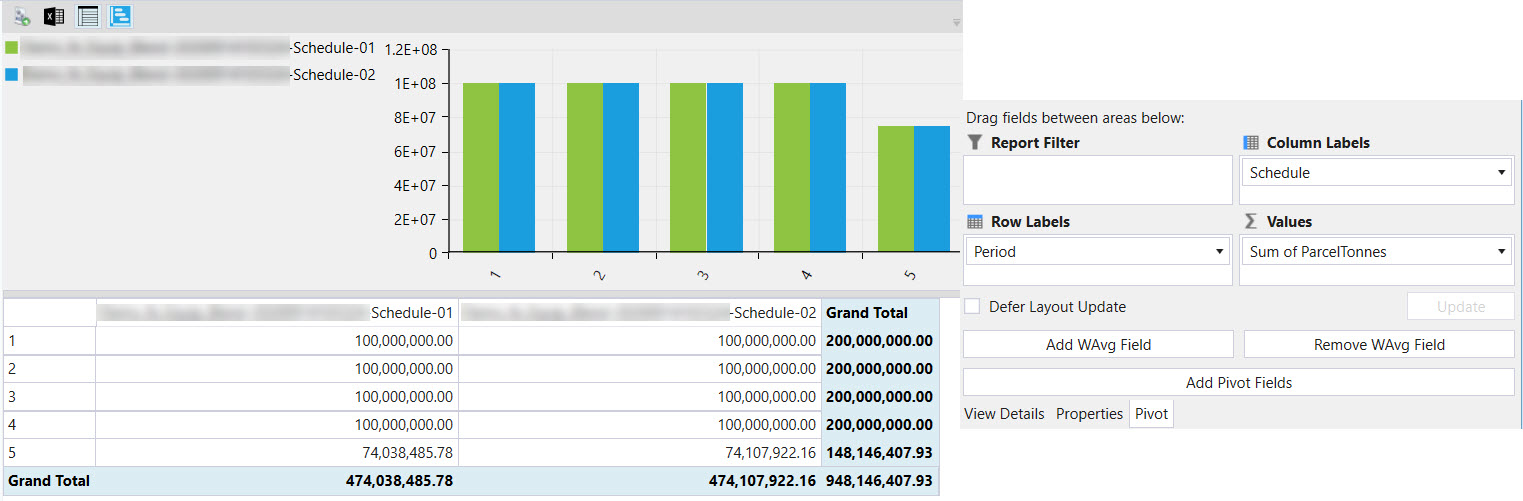
In the example below, we display the number of parcel tonnes mined in each bench (column) per period (row). The data is filtered to only show material being sent as waste.
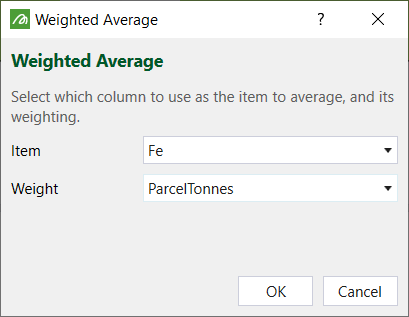
- Optionally, create an add weighted average fields by completing the following steps:
- Click Add WAvg Field underneath the Row Labels area.
- Select a field to average by setting Item and a Weight to calculate the weighting. Click OK on the panel, once you are happy with the settings.
- Go to your fields list and scroll down to the bottom. The newly created weighted average field will be stored under Weighted Average Fields. Select the checkbox next to the newly created field. It will be added to the ∑Values area.
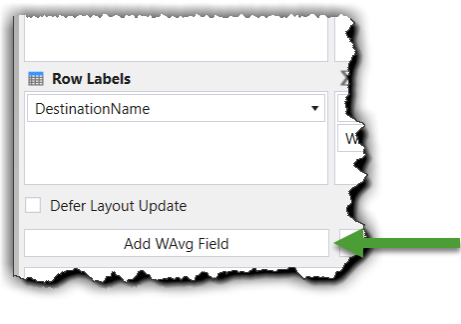
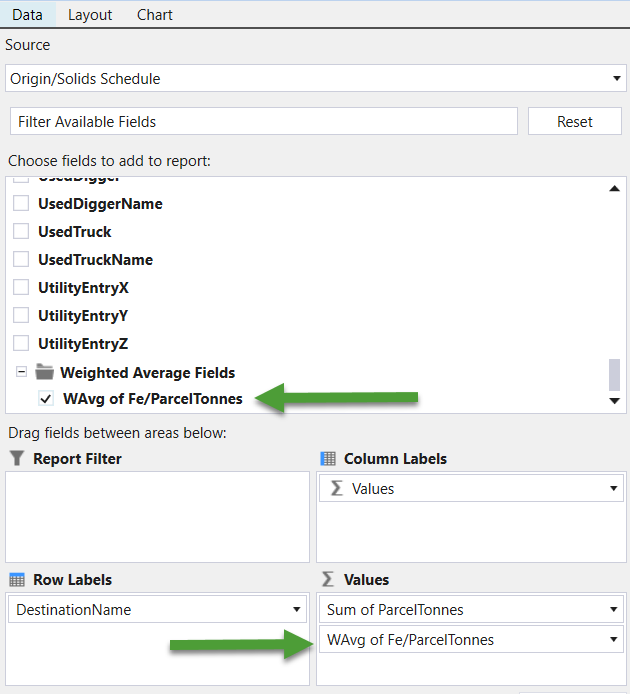
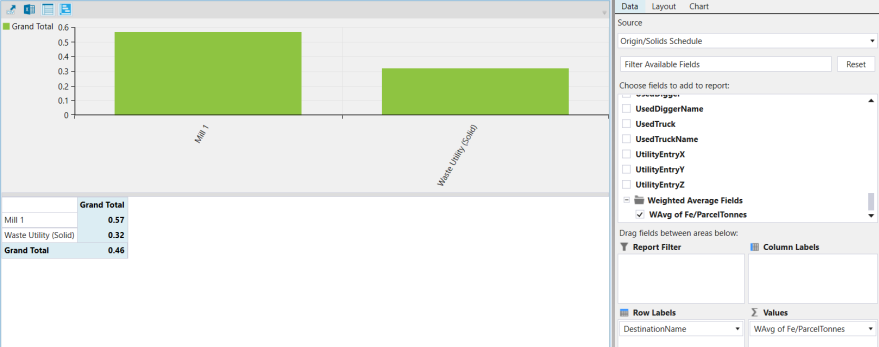
In the example below, we use a weighted average field called WAvg of Fe/ParcelTonnes to calculate the iron grade of material going to the mill and the waste dump.
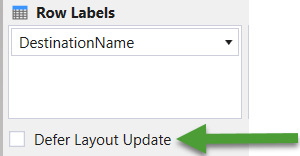
- Optionally, select Defer Layout Updates if you want to make many changes to the pivot report without the pivot report updating multiple times.
The newly created pivot report will be stored under your project explorer. Evolution will automatically open the file in the Workspace where the viewer usually resides.
Add multiple schedules or models to a single pivot report
It is possible to add multiple schedules or models to the one pivot report by holding down the Ctrl key, selecting each schedule or model and then dragging them into the workspace.
Copy pivot report to clipboard
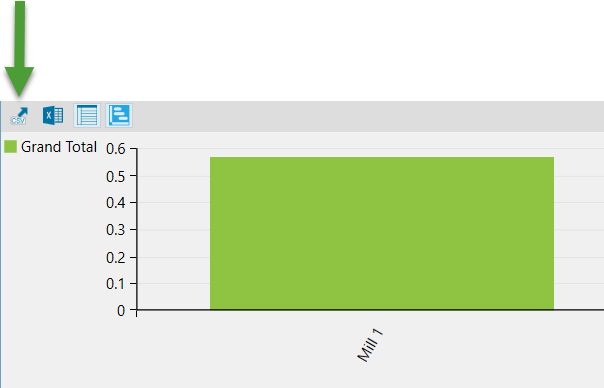
A pivot report can be copied and pasted into a Microsoft Excel spreadsheet by clicking the ![]() (Copy report to clipboard) icon which is located above the workspace.
(Copy report to clipboard) icon which is located above the workspace.
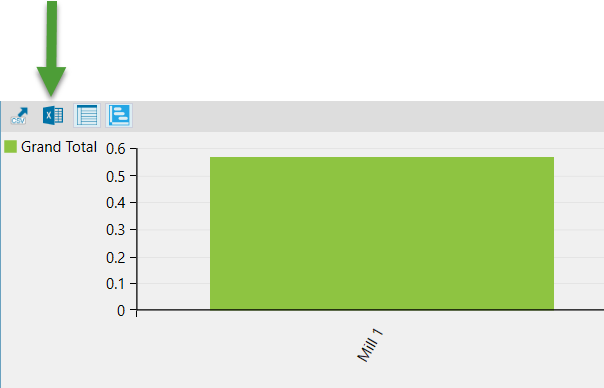
Export pivot report to Microsoft Excel
If the data needs to be stored separately, it can be exported using the Export to Excel icon above the workspace.