6. Analyse the Schedule
Source file: 6-origin-solids-schedule-analyse.htm
There are a number of tools available to you inside Evolution to evaluate a schedule, once you have downloaded the schedule.
Fitness Report
Double click the schedule collection in the project explorer to view the fitness report.
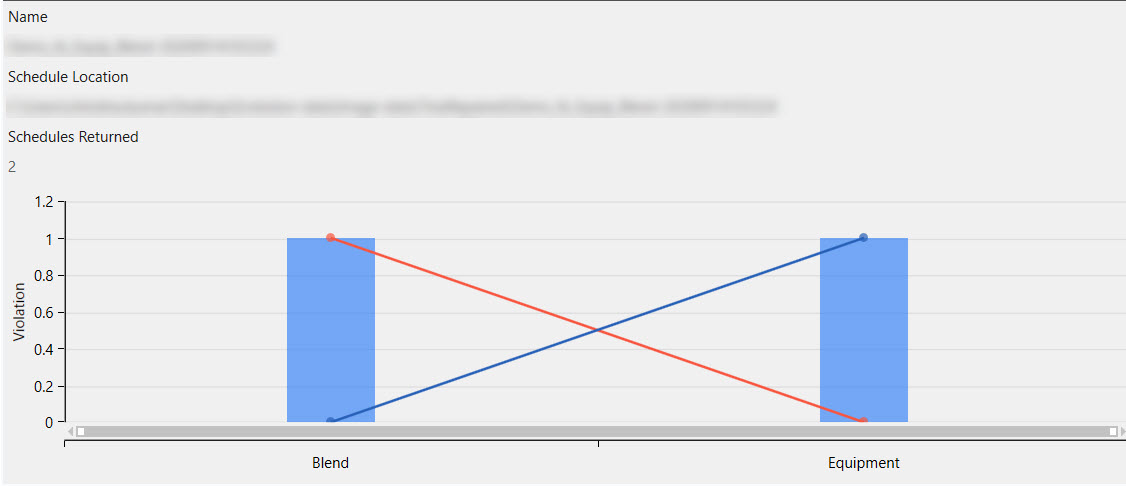
In the above schedule collection, two schedules have been returned; one meets the blend objective but violates the equipment objective while the other meets the equipment objective but violates the blend objective.
Schedule Viewer
Viewing a schedule
To view an Origin Solids schedule, follow these steps:
-
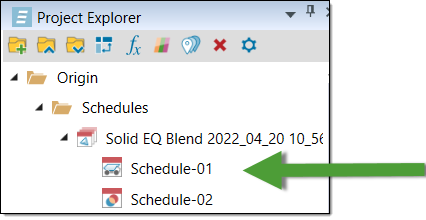
Double click on the schedule in the project explorer to open the schedule viewer.
-
You can use the following options to play the schedule:
-
Click
 to play the entire sequence
 -
Click
 to step through the sequence
 -
Drag the slider to move through the sequence
-
-
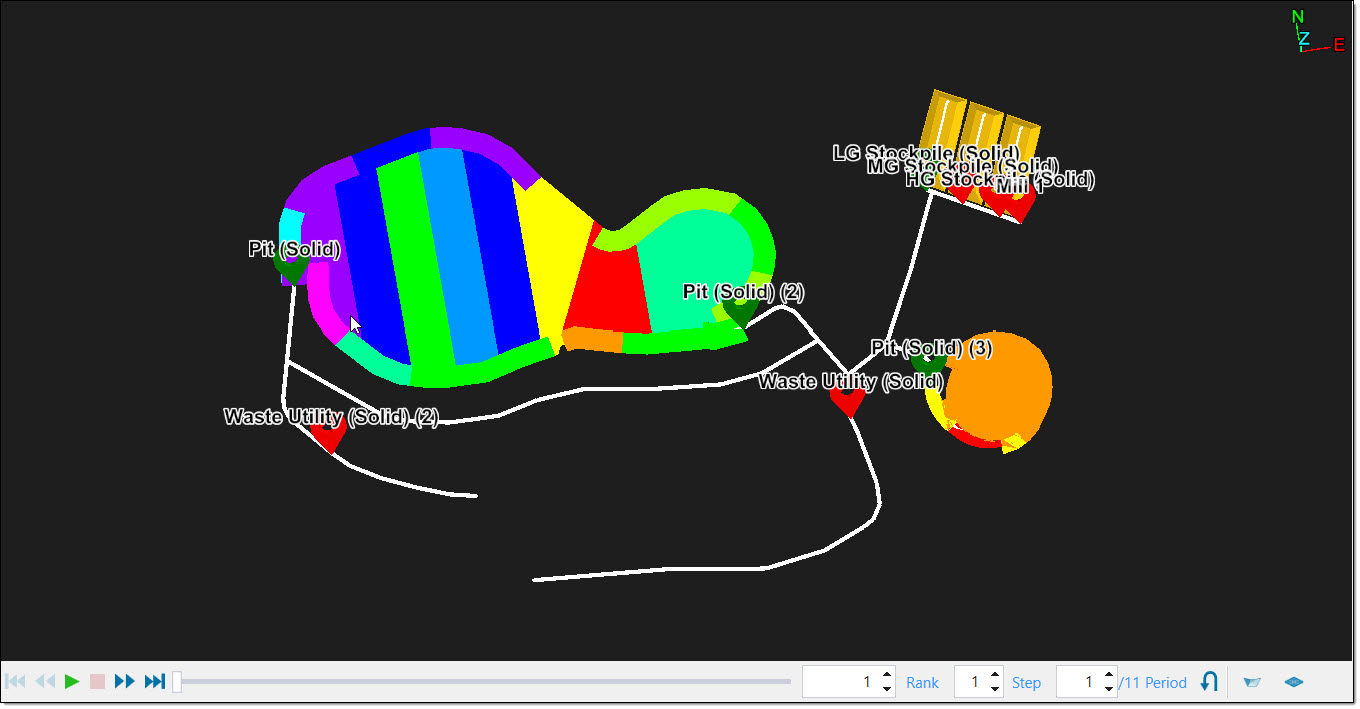
In the schedule viewer, the solids are coloured by mining period. The mine waypoints and road networks are also shown in this view.
-
If you play the sequence, the solids disappear from the pit as they are mined out. Alternatively, to see the solids appear in the pit, you can click
 to step through the sequence in reverse.
-
You can also adjust the step of the sequence to run through the schedule faster. To do this, write an increased value into the Step text area.
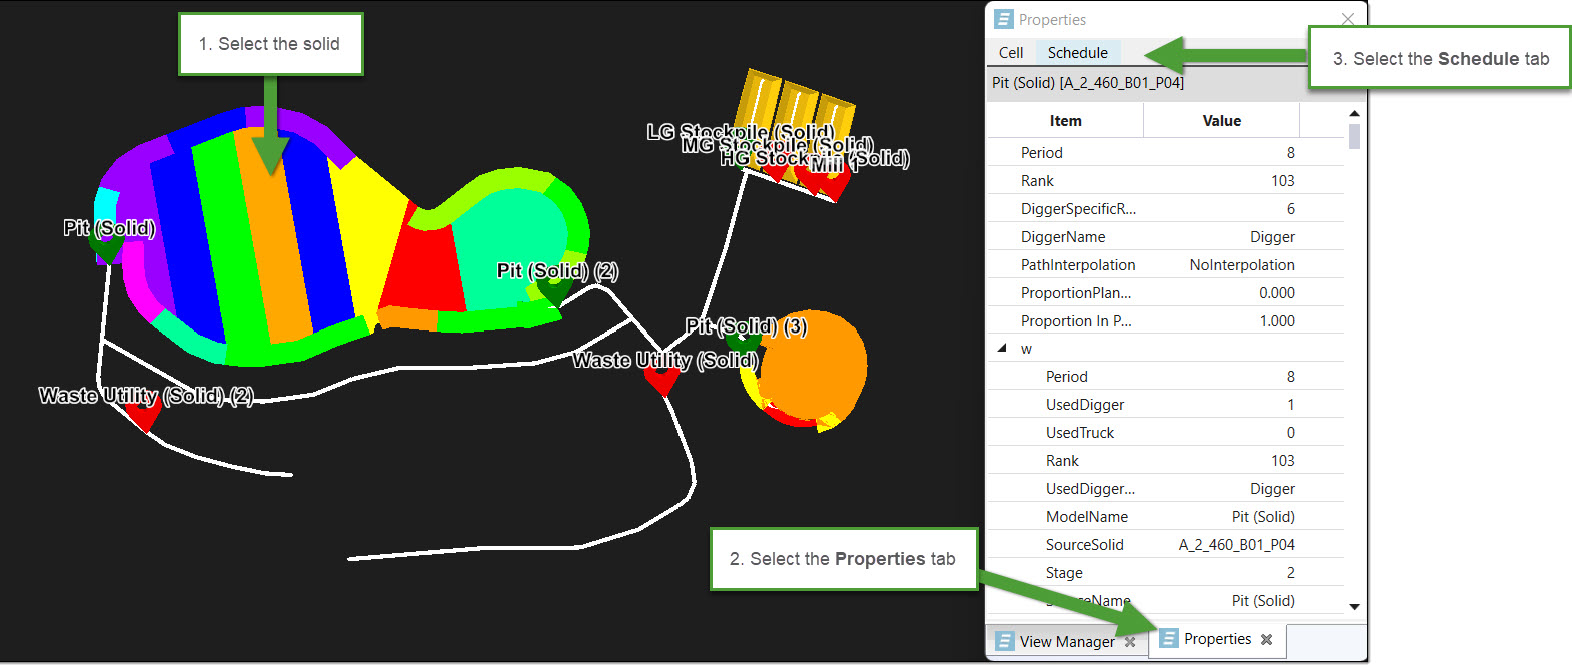
Viewing the schedule properties of a solid
When you view a schedule sequence, Evolution provides the ability to inspect the properties of a particular solid. For example, you can view the following:
-
The period the solid was first mined in
-
The equipment used to mine the solid
-
The haulage information for equipment setups
To view the schedule properties of a solid:
-
Select the solid in the schedule viewer.
-
Select the Properties tab.
-
Select the Schedule tab.
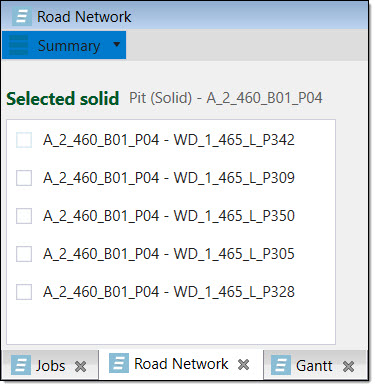
Viewing haulage routes
To view specific haulage routes and their endpoints, follow these steps:
-
Select the Road Network tab in the report window.
-
Select a solid to view its haulage routes. All the routes connected to the selected solid will be listed under Selected solid.
-
Select the checkboxes of the routes you wish to highlight in the report window. To view the details of a specific route, ensure only that route is selected and the specifications will appear in the three Summary columns in the report window.
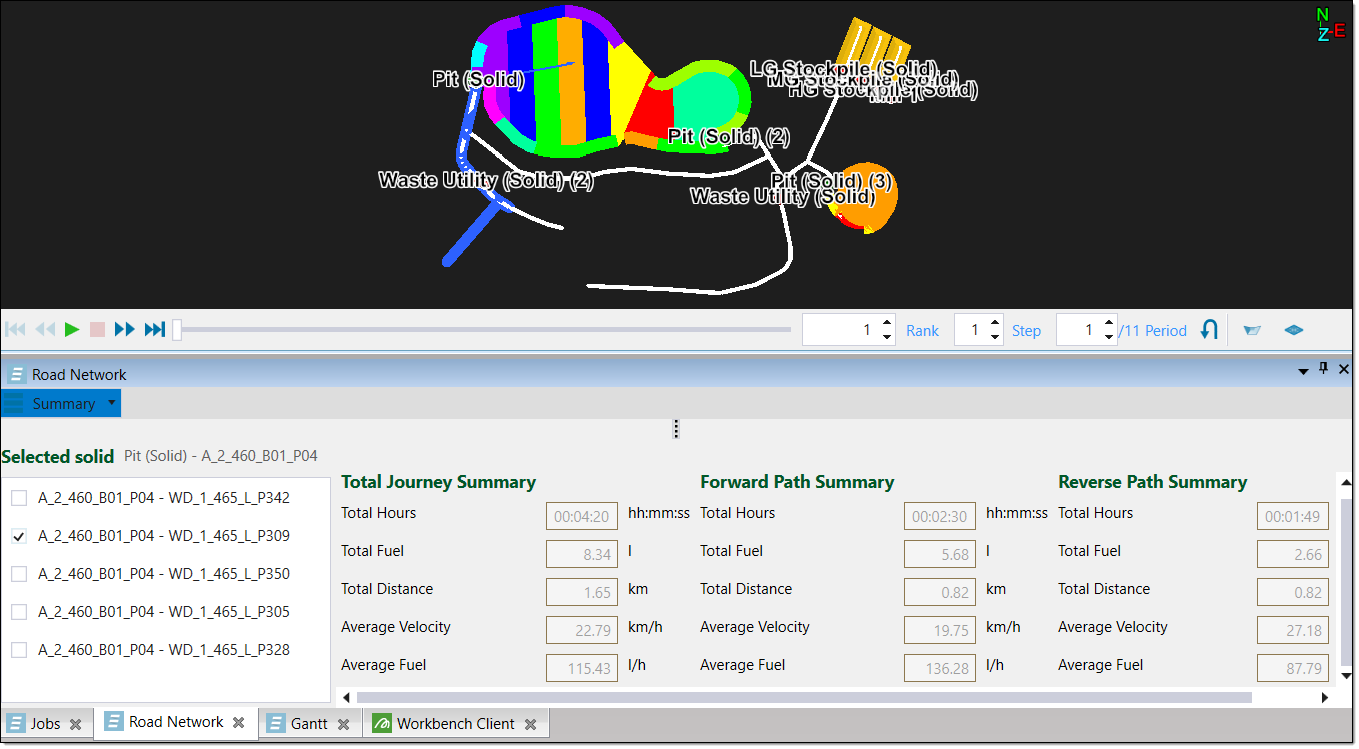
The haulage route details can also be viewed in the form of a Chart or as Detailed Info. You can find these options in the top left corner of the report window by clicking on Summary. In the dropdown menu, select the information form you wish to use.
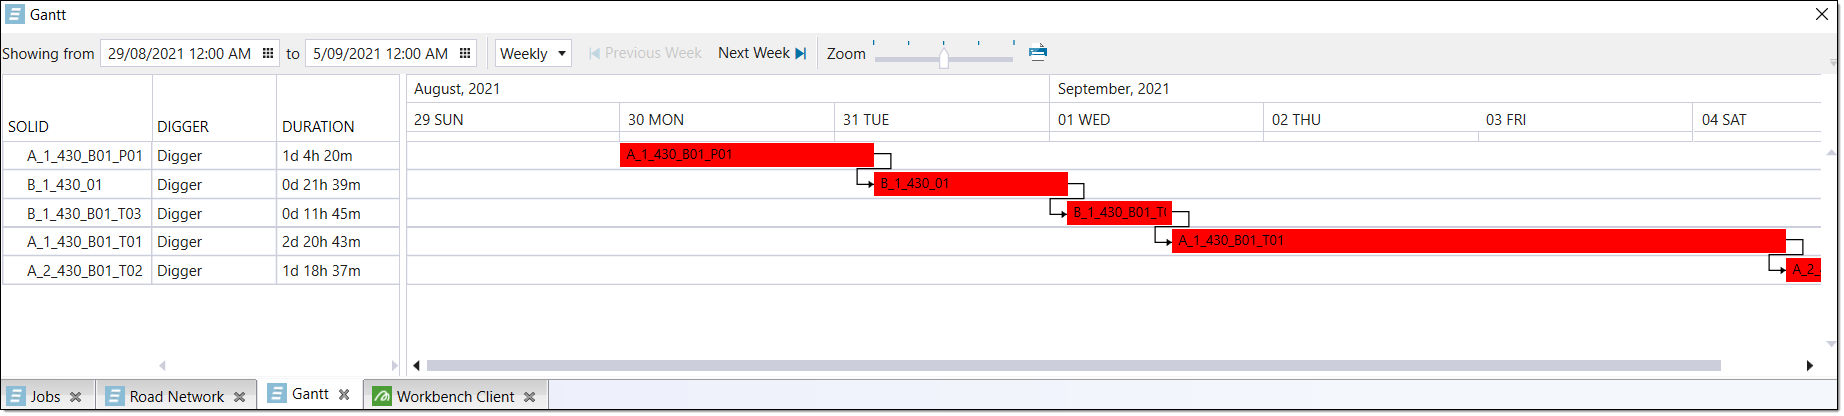
Using Gantt charts
The Gantt tab provides you with a Gantt chart view of your schedule. To use this tab, select the Gantt tab in the report window.
-
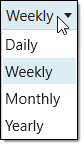
To change the period of the chart, select Weekly and choose the time period you desire from the dropdown menu.
-
For a more specific time frame, you can click
 next to Showing from and select the dates you desire.
-
You can use the Zoom slider to zoom in and out of your chart.
-
Click
 to print your chart.
Schedule Report
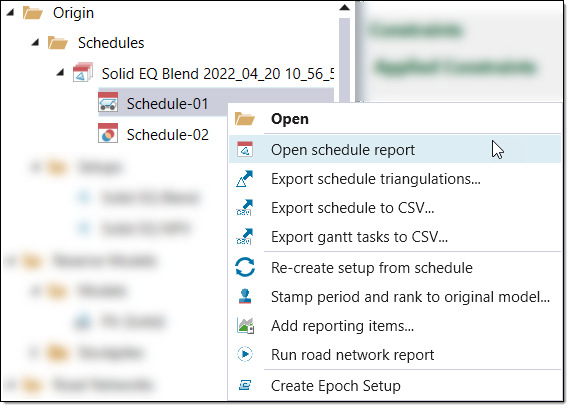
To open the schedule report, right-click on the schedule and select Open schedule report from the context menu.
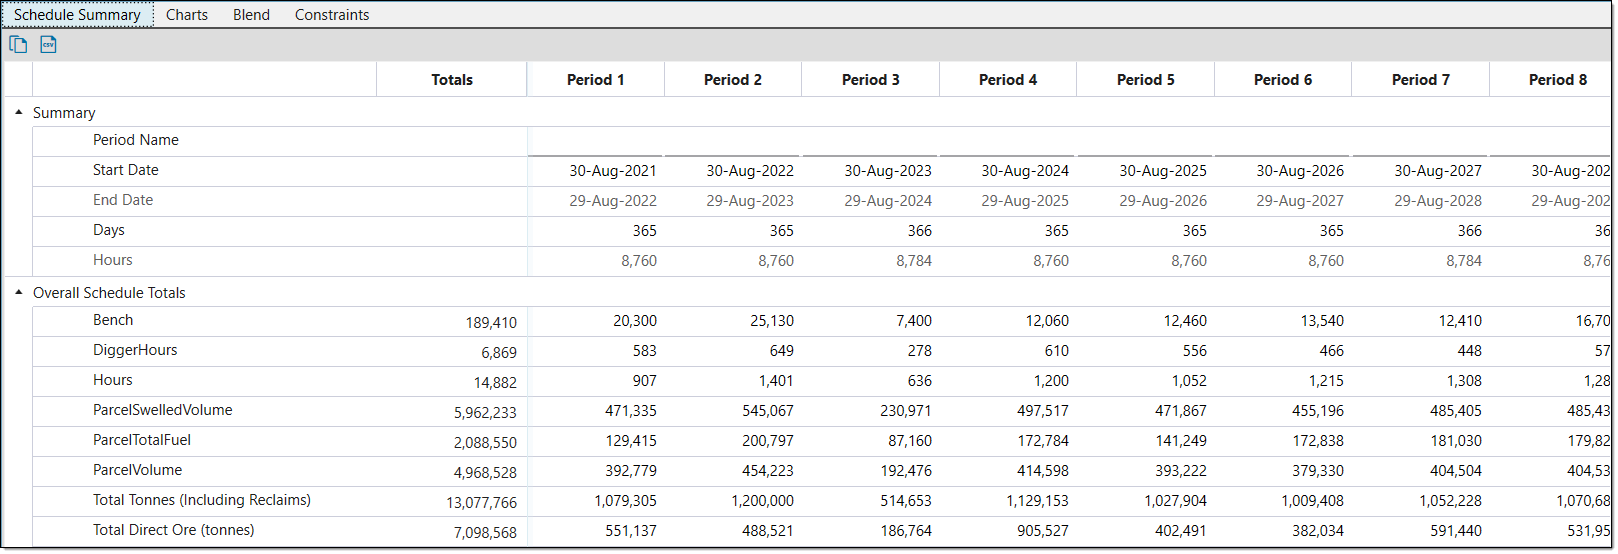
Evolution loads the schedule report in the workspace. The schedule report ribbon contains the following tabs:
Schedule summary
The Schedule Summary tab contains the following information groups:
-
Overall Schedule Totals: Reports the primary mining and processing data per period.
-
Equipment Counts: Shows the amount of each equipment type that is required per period.
-
Mill or Process: Reports the parcel, equipment and cost details of a mill or process per period.
-
Waste: Shows the waste tonnes mined in terms of benches, ore types and parcels.
Charts
The Charts tab displays charts based on variables in the Schedule Overview. If applicable, each chart will also feature a line depicting a chart target. This allows you to compare the schedule values against the targets set in the schedule setup. You can view the following charts in this tab:
-
Accumulation Tonnage
This chart displays the total tonnes accumulated at each destination per period. As seen by the red line, the End of Period Target was set to Accumulation in Calendar > Targets for the first three periods of the schedule.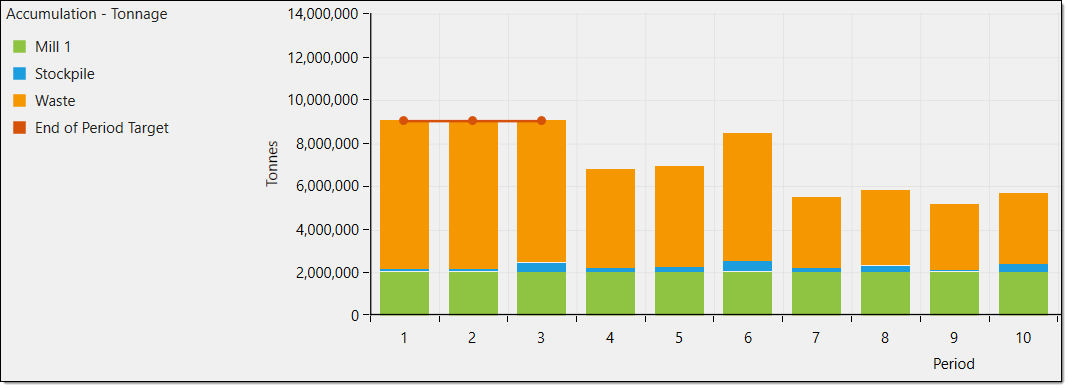
-
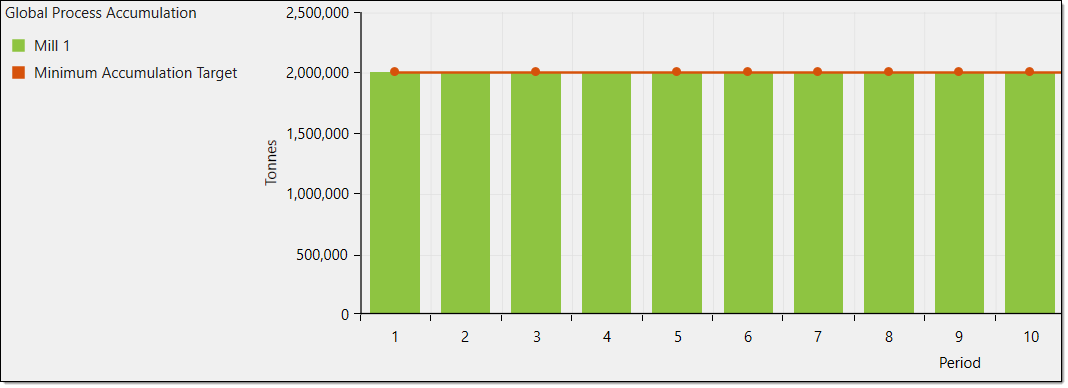
Process Accumulation Tonnage
This chart displays the mined tonnes accumulated at a process or mill per period. As seen by the red line, the End of Period Target was set to Process Accumulation in Calendar > Targets from period four onwards.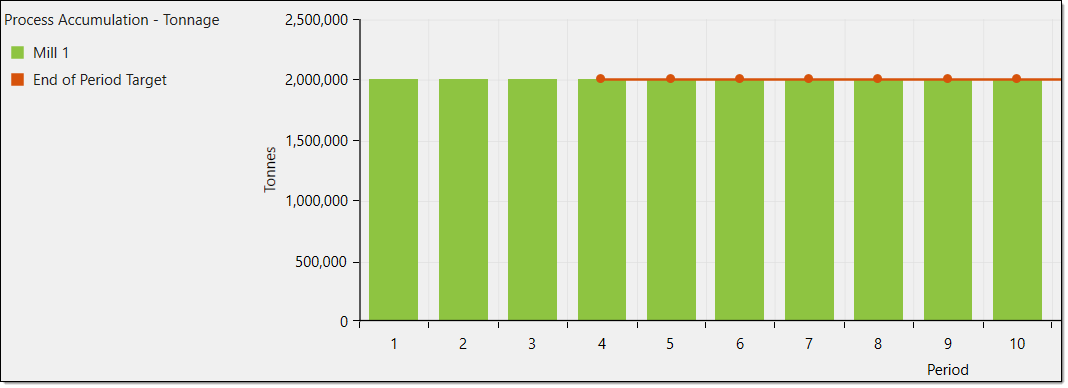
-
Process Accumulation Volume
This chart displays the volume of mined material accumulated at a process or mill per period.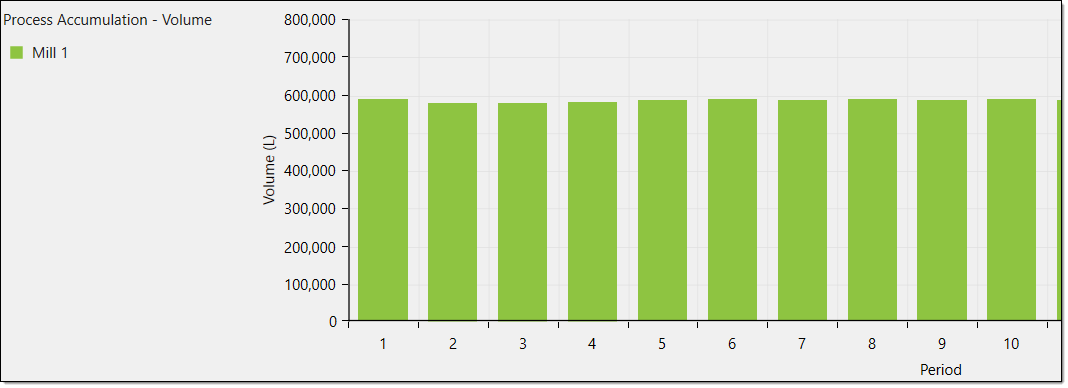
-
Accumulation Volume
This chart displays the total volume of mined material accumulated at each destination per period.
-
Equipment Time
This chart displays the total number of hours equipment was used at each destination per period. The grey line represents the equipment time capacity in hours.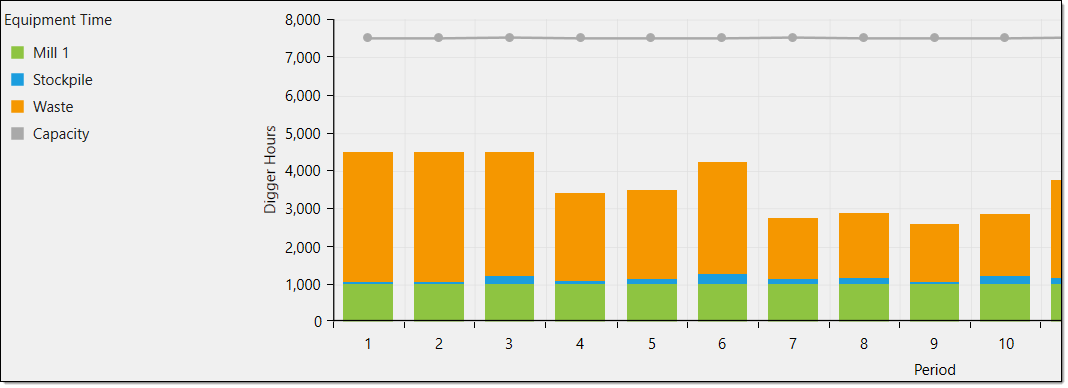
-
Tonnages
This chart displays the total tonnages per period, including those reclaimed from stockpiles.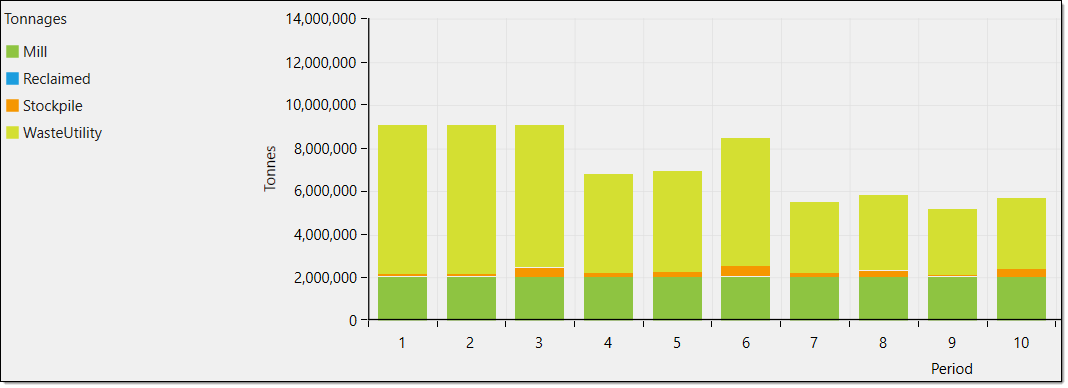
-
Stockpile Inventory
This chart displays the parcel tonnes present at a stockpile per period. This chart is also displayed for other categories listed in Process Setup >
  Parcel Reporting, such as volume and swell factor.
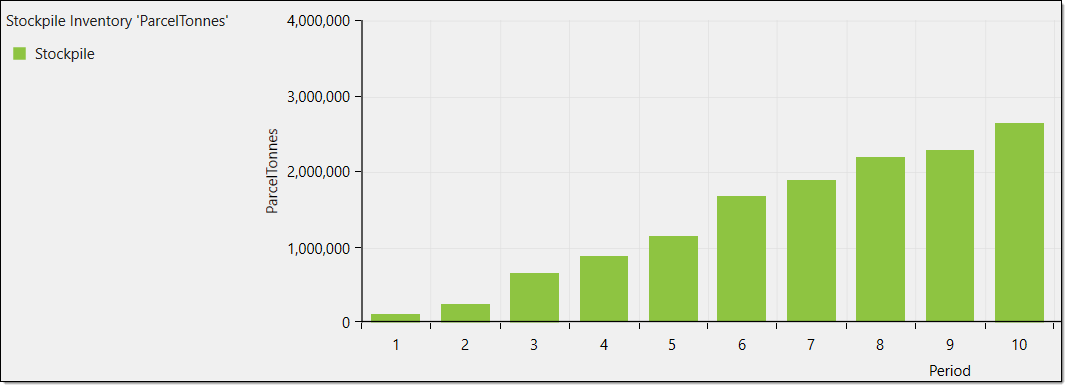
-
Material
This chart displays the Fitness Violation of the material movement objective per period. For an equipment setup, an equipment chart displaying the fitness violation would be shown.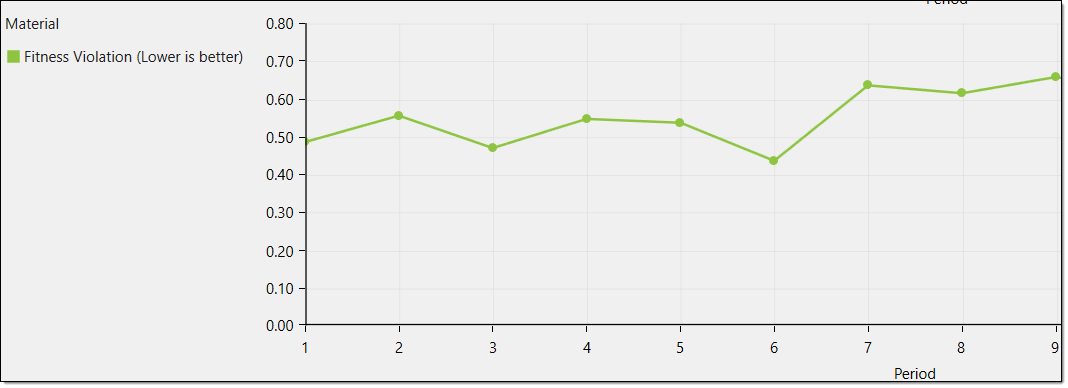
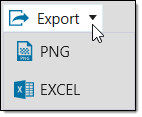
You can export these charts by clicking Export in the top left corner of the workspace. In the drop-down, select either a PNG or EXCEL export.
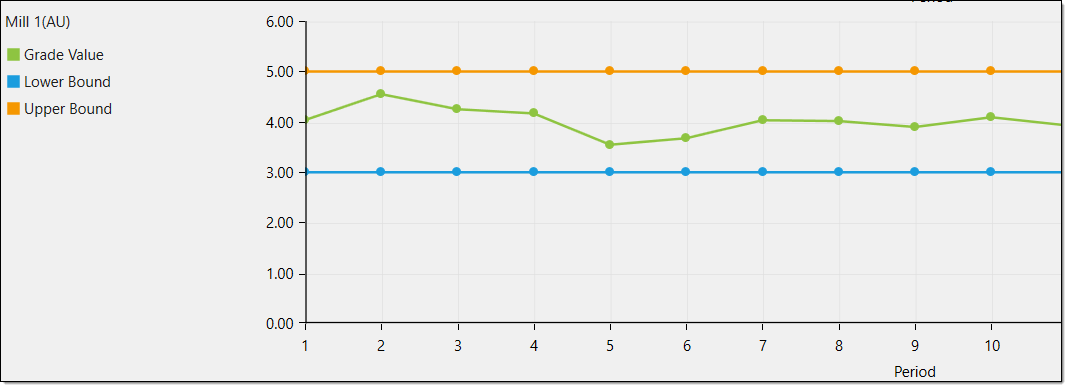
Blend
This tab contains the blend charts of the schedule. Blend charts illustrate the Grade Value, Lower Bound and Upper Bound of a process item.
This tab only appears if you included a blend constraint in the schedule setup.
Constraints
You can view charts of the schedule constraints in the Constraints tab. These charts will also feature lines which represent constraint targets.
This tab only appears if you selected a constraint in the schedule setup.