Grade Bins
Source file: new-grade-bins.htm
Understanding Grade Bins
Strategy creates a schedule in which the extraction sequence of material is performed on a stage and bench combination basis, and not on the level of an individual block. When generating a schedule, Strategy must first aggregate the blocks in the block model into a grade tonnage curve and determine the target destination of the material to be mined. Strategy takes the stage order into account in these calculations, but will ignore it if the calculations show that this would provide better value.
The purpose of using Grade Bins in Strategy is to determine the properties of the material above a given cut-off grade in a given stage or bench. This allows the engine to send parts of the material in a stage bench (the parts above the cut-off) to one process (the mill) and the remainder to another process (waste, stockpile etc.). As Strategy models tend to be very large, individually checking if the grade of each block is above the cut-off would require intensive computation. Using Grade Bins simplifies this process. Grade bins cover the continuous range of 0 to infinity, and Strategy represents these bins as histograms, in which each bin has a lower and upper bound.
Choosing Grade Bins
The based-on-practice rules that can aid in choosing a good grade bin distribution are as follows:
-
Most models can be adequately represented with 10 to 20 bins. More than 20 bins is unlikely to provide any useful detail, but will extend processing times.
-
The average grade for material in a bin should be within the middle third of the grade range of the bin.
-
No interpolation can occur on the first and on the last bin, so they should be completely above or below the point where any process cut-off grade is expected.
Creating Grade Bins
There are three ways to create Grade Bins in Evolution:
-
Let Evolution automatically create grade bins
This option provides you with optimally spaced (approximately evenly distributed) grade bins.
-
Generate evenly spaced grade bins
This option allows you to generate simple grade bins by entering three parameters.
-
Generate uniquely spaced grade bins
This option allows you to generate grade bins with custom bin spacing.
Let Evolution automatically create grade bins
To enable Evolution to do this, follow these steps:
-
From the setup configuration tabs, select Grade Bins.

-
Select Config View in the grade bins ribbon.

-
Select
 in the Grade Bins ribbon. The Automatic Grade Bins Generation window will appear.
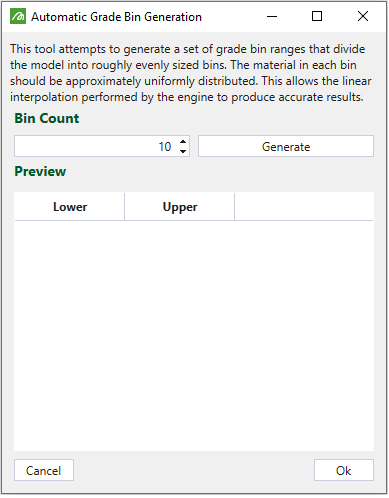
-
Enter the number of bins you desire into the Bin Count field.
Note: The number of bins to be generated will be equal or less than the number that you input in the Bin Count field. The grade algorithm always tries to find the best and the most optimal solution, so if it determines that the solution consisting of e.g. 8 bins will be better than the one consisting of the exact number that you entered (e.g. 10), it will generate 8 grade bins.
-
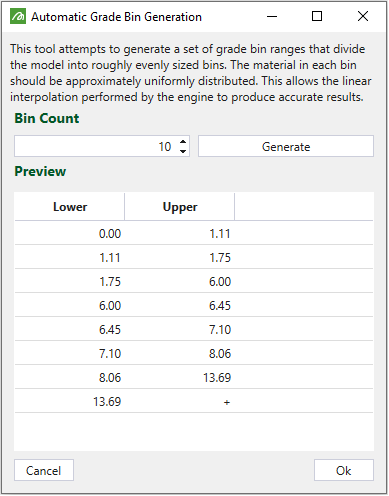
Click Generate. Under Preview, you can view the upper and lower bounds of the bins.
-
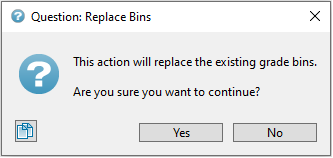
Click Ok if you wish to use these bins. A message will appear warning you that any current bins in the setup will be replaced. Click Yes to confirm the replacement.
Generate evenly spaced grade bins
To generate evenly spaced grade bins, follow these steps:
-
From the setup configuration tabs, select Grade Bins.
-
Select Config View in the Grade Bins ribbon.
-
Select
 (Generate grade bins). The Generate grade bins fields will appear in the window.
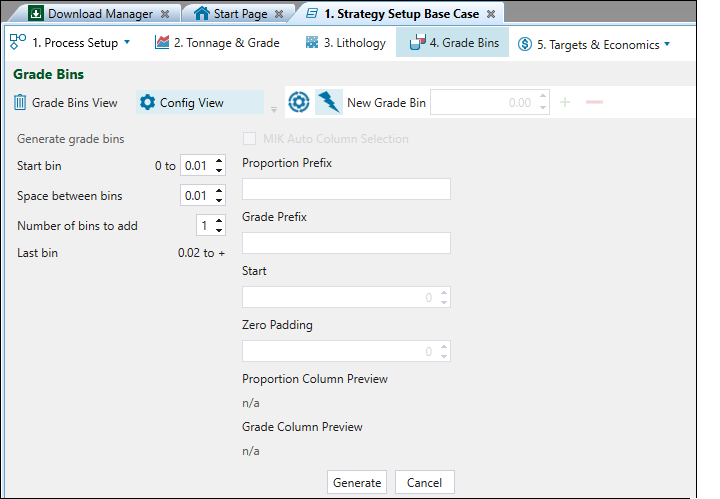
-
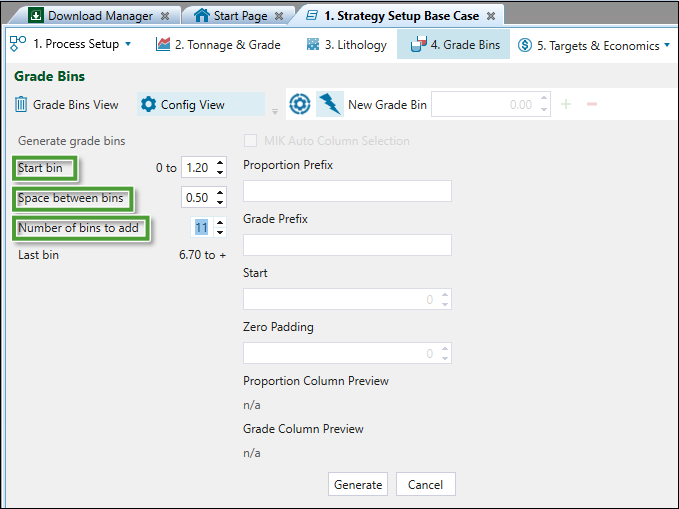
Configure the Start bin, Space between bins and Number of bins to add fields as desired.
-
Click Generate.
Generate uniquely spaced grade bins.
To generate uniquely spaced grade bins:
-
From the setup configuration tabs, select Grade Bins.
-
Select Config View in the Grade Bins ribbon.
-
In the New Grade Bin field, enter an upper bound for your first grade bin and click
 . Strategy will add this bin to the table. Repeat this step to add additional grade bins.
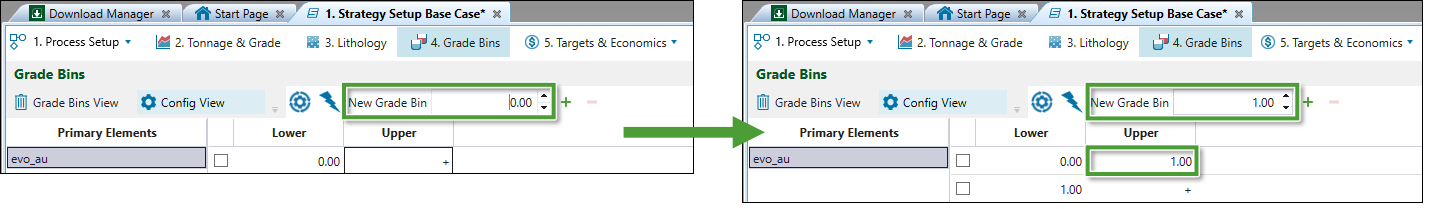
-
Optionally, to delete a grade bin, select the bin in the table and click
 .
.
Processing
Once the bins are created, Strategy sorts each block into their respective bins for each stage, bench and lithology. Strategy will then apply the cut-off grade to the histogram to work out the tonnages available for the process. To aid in calculating this tonnage, Strategy keeps track of the weighted average of each bin during the sorting process. Two different scenarios can occur when Strategy applies the cut-off:
-
The cut-off aligns with a grade bin bound
If the cut-off lies on either the upper or lower bound of a grade bin, Strategy can easily calculate the tonnages above this cut-off point.
-
The cut-off lies inside a grade bin
If the cut-off lies inside a grade bin, Strategy will interpolate into the bin to attain the tonnages above the cut-off point. To do this, Strategy creates a cumulative distribution of the bin.
Important: If the grade bins are not uniformly distributed, the calculation of material above a given cut-off will become inaccurate. To create uniformly distributed grade bins, ensure the bin average falls in the second or third quartile of the distribution.
Strategy then determines the tonnages and average grade above the cut-off grade on this distribution. Next, it incorporates these values to the remaining tonnages and averages above the upper bound of the bin to provide you with a total tonnages and average grade above the cut-off point.
To determine the tonnages and average grade of a material above a cut-off grade, the following three processes are required:
-
Assessing if the grade of each block is above the cut-off grade
-
Taking the blocks with grades above the cut-off and calculating an average grade
-
Determining the total tonnage of all these blocks
Grade bins in single element setups
In setups with a single element, Strategy will use straight-line interpolation to determine this tonnage. This allows for any cut-off to be selected, and for the appropriate tonnage to be sent to any processes or stockpiles. In effect, this uses the grade bins to define a grade-tonnage curve. Since straight-line interpolation is used, it is important that enough grade bins are used to define the curve, and that smaller bins are used in areas where the curve is less likely to be represented by a straight-line between bins. For more information on the single element setups, see Single element setups.
Grade bins in multi-element setups
In multi-element setups, Strategy must choose process cut-offs that correspond with bin boundaries. No interpolation can occur. A larger number of bins might therefore be desirable to provide more cut-off choices for any stockpiles and processes. For more information on the multi-element setups, see Multi-element setups.
Viewing grade bins
After generating the grade bins, you can view the bin properties on the Grade Bins View screen in three modes:
-
Tabular view
-
Chart view
-
Pie chart view
These views display the amount of material calculated per interval for each primary element that has been added to the setup.
 Tabular view
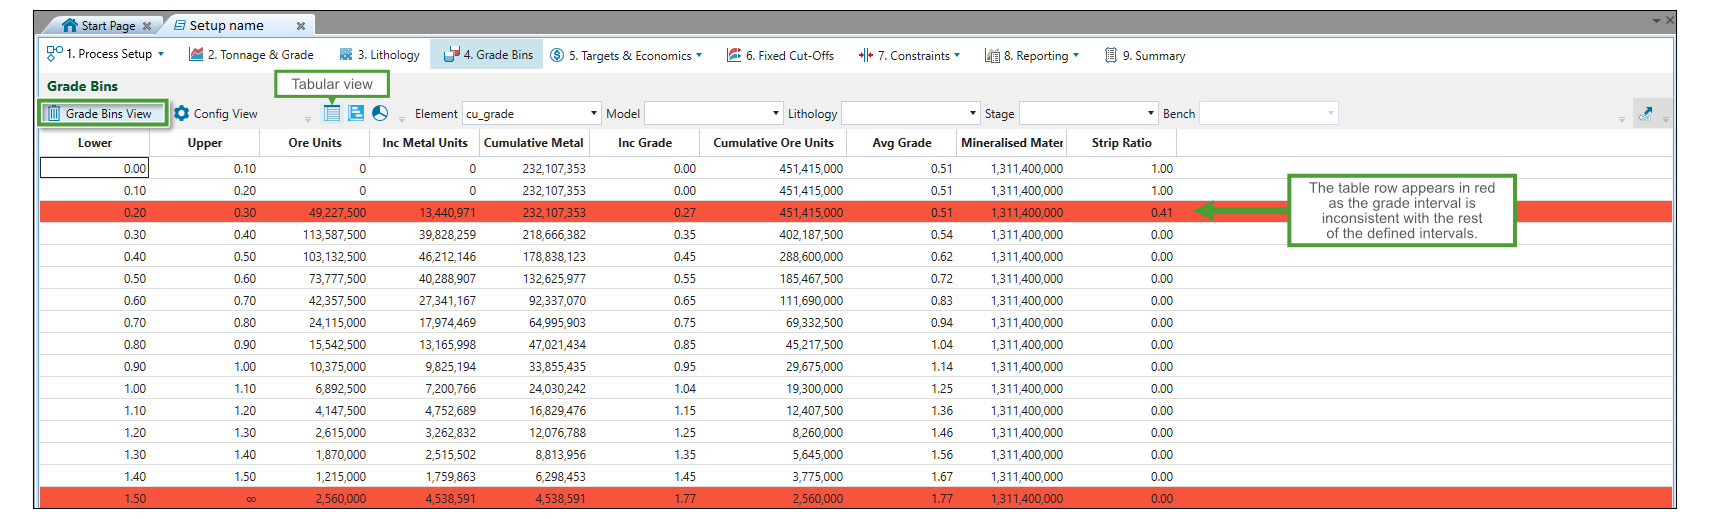
You can filter displaying the data by Element, Model, Lithology, Stage, and Bench.
 Chart view
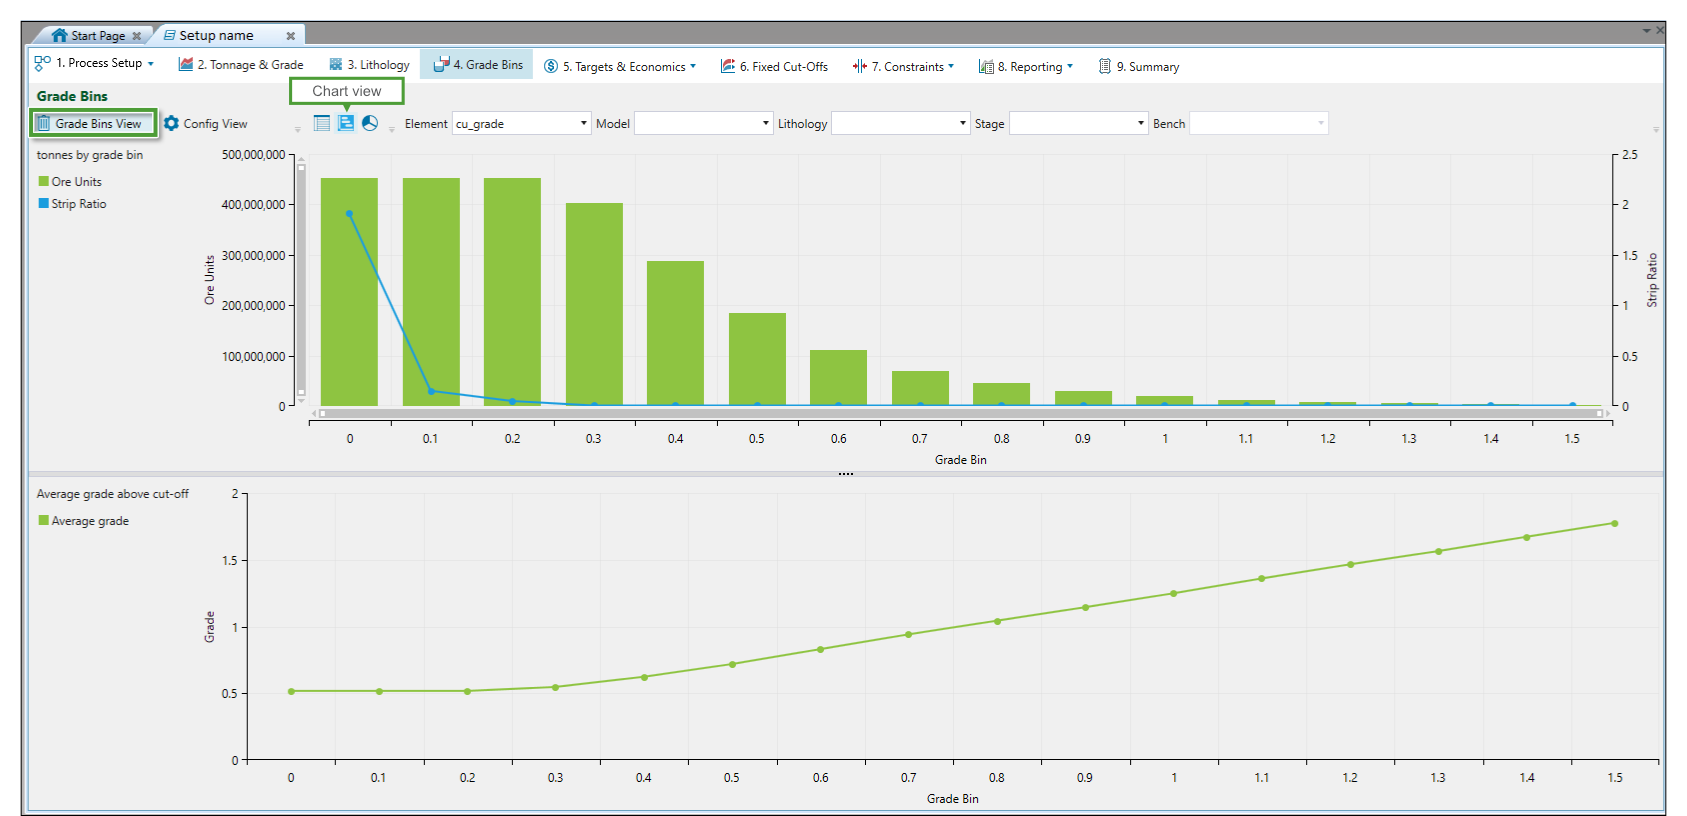
As in Tabular view, you can filter the displayed data by Element, Model, Lithology, Stage, and Bench.
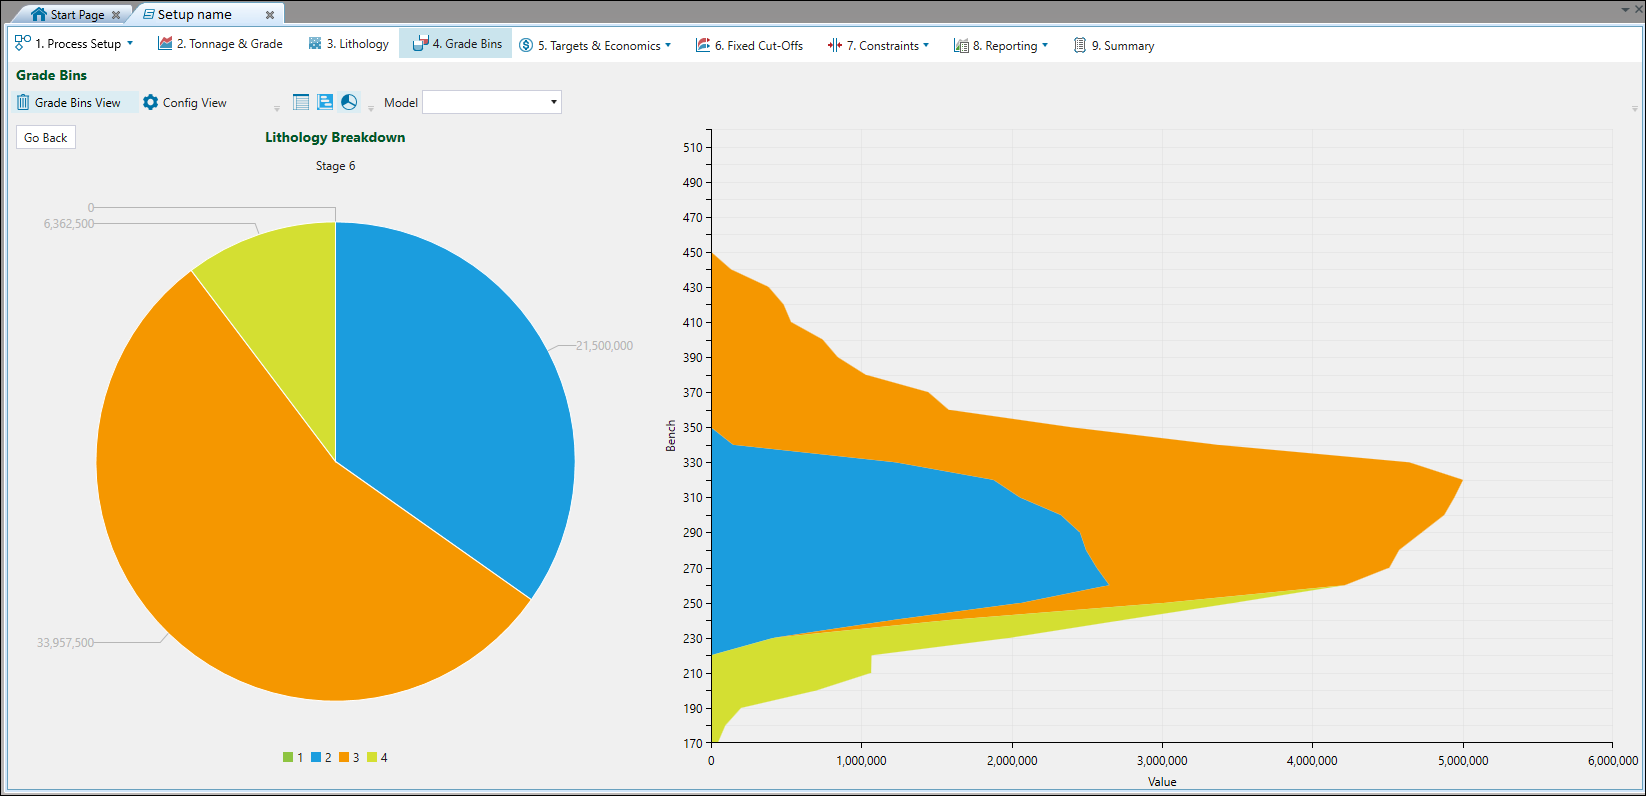
 Pie chart view
Pie chart view displays the overall lithology breakdown, as well as the detailed lithology breakdown by each stage.
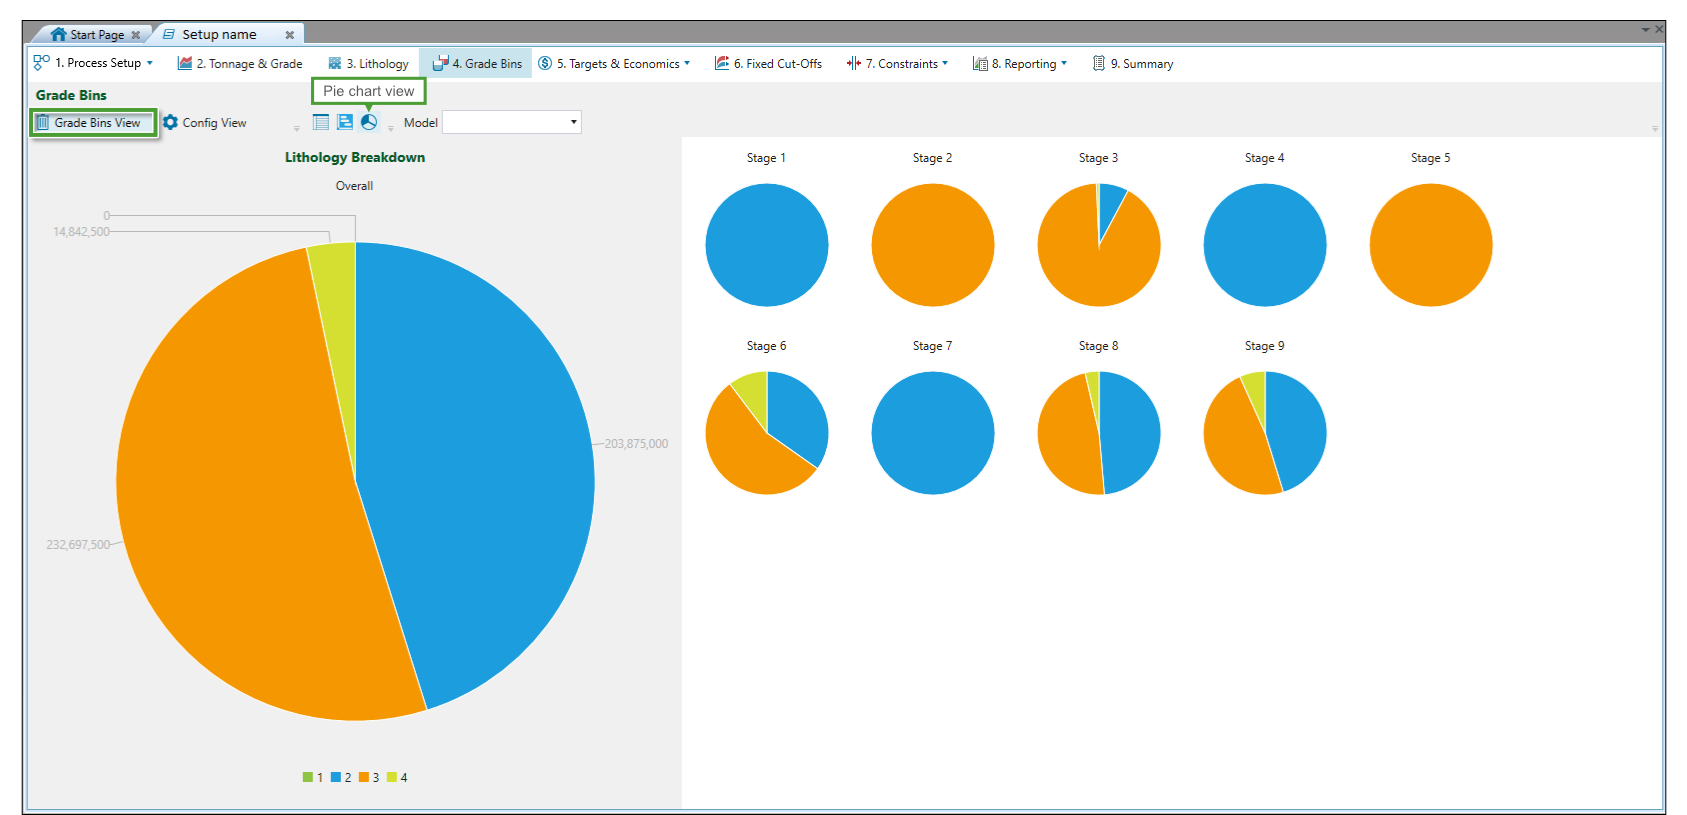
To view the detailed data from a particular stage, click on the selected stage that is displayed on the right side of the screen: