Live Dashboard
Source file: epoch-schedules-live-dashboard.htm
Pivot reporting in Live Dashboard
You can analyse your results by creating pivot reports in the Live Dashboard. For more information on pivots, see Pivot Reporting.
Follow these steps to generate a pivot report in the Live Dashboard:
-
Generate a schedule (see 4. Generate and View the Schedule for more information).
Tip: You do not have to save the schedule to view it in the Live Dashboard.
-
Select the Schedule Playback tab from the Reporting Window tabs.

-
In the Schedule Playback tab, select
 Dashboard from the Reporting section .
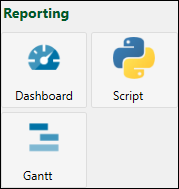
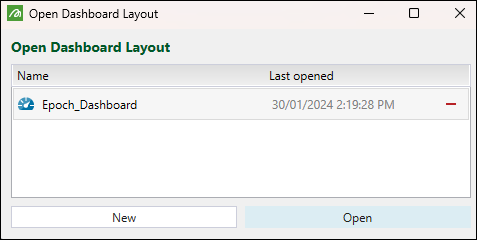
The Open Dashboard Layout panel will appear.
-
Choose an existing layout or create a new layout for the Live Dashboard.
-
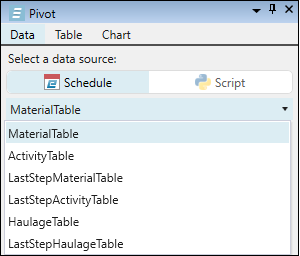
In the Pivot section on the right side of your screen, select
 Schedule or
  Script as your report data source, and then select the report type from the drop-down menu. For more information on the Python report scripts in Epoch, see Python Report Scripting.
-
From the list of available fields, select the attributes to be included in your report.
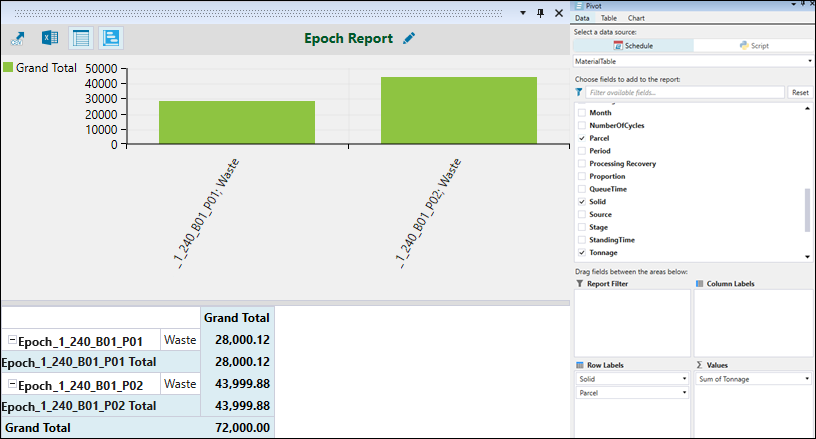
Tip: Your pivot reports will update automatically as you step through the schedule in the Schedule Playback tab.
Material Table and Activity Table in Epoch pivot reports
Epoch allows you to get information about each piece of equipment and its operation in each reporting period. These records can vary as a site’s operational productivity can be different at each stage. As a result, each step in time will produce a set of associated records for what happened during the step. The MaterialTable and ActivityTable are two main tables that are generated as an output of running the Epoch evaluator.
MaterialTable
The MaterialTable contains the records for all material that was moved over a given step. These records include equipment working in the pit and delivering material to the mill or waste, as well as the information on the stockpile reclaims. As MaterialTable only reports on the material that is moved and processed, it will not include information about activities that do not have output parcels.
Each record that is created in the MaterialTable has all reporting items that you have defined (Parcel Items through the Parcel Reporting, see Parcel Reporting for more information), and the default items that Epoch populates.
The table below shows the default attributes that you can include in the MaterialTable.
| Reporting attribute | Description | Example value |
|---|---|---|
| Activity | The activity being worked on. | Loading & Hauling |
| Bench | The bench of the source material. | B_220 |
| CycleTime | The time taken by a truck to complete a full cycle from source, to the destination and back to the source (including loading time) in seconds. |
1230.4 |
| DateRounded | The date that the step started in, formatted as YYYY-MM-DD. | 2024-01-28 |
| Day | The day of the month that the step started in, stated in the range 1–31. | 28 |
| Destination | The name of the destination. | South_A |
| DestinationSolid | The name of the destination solid. This attribute is only set when the DestinationType is a stockpile or waste. |
South_A_220 |
| DestinationType | The type of the destination for the material. Available destination types include Mill, Stockpile, OverflowStockpile, and Waste. |
Mill |
| Distance | The distance taken for all cycles within a step. |
220000 |
| DumpSpotTime | The time (stated in seconds) for a truck to position itself so that it can dump material. | 20 |
| DumpTime | The time it takes to dump material in a waste dump (typically 30 seconds). | 30 |
| Duration | The duration taken to complete a given proportion a solid. This can give numbers higher than 24 hours in a day in scenarios with multiple parcels. Further breakdown reports by parcel to see the value. |
48 |
| Equipment | The name of the primary equipment used. | Digger A |
| Fuel | The amount of fuel that was consumed by a truck over a travelled path. | 1200 |
| FuelPerHour | The average rate of truck fuel consumption over a travelled path. | 110 |
| Hours | The number of hours that a truck spent driving or being loaded (this time does not include spot or dump times). |
11.2 |
| LoaderSpotTime | The time (in seconds) for a truck to position itself under the digger. | 20 |
| LoadingTime | The time (in seconds) for a truck to be filled with material from the digger. | 30 |
| Month | The month of the year that the step started in, stated in the range 1–12. | 2 |
| NumberOfCycles | The number of cycles that the truck would have to perform to move the mass or volume of the record. These partial cycles are used as it is assumed that the remaining proportion of the cycle would be used for the next produced material. |
3.4 |
| Parcel | The name of the parcel. | ORE |
| Period | The reporting period that the records were generated within. | 2 |
| Proportion | The proportion of the solid completed. This attribute can give numbers higher than 1 in scenarios with multiple parcels. | Further breakdown reports by parcel to see the value. |
0.65 |
| QueueTime | The time (in seconds) it takes for a truck to wait for other trucks that are already loading or dumping. | 20 |
| Solid | The value of the ID attribute on the solid of the source material. | SA_B140_2 |
| Source | The name of the source of the material (either the name of a pit or stockpile). | South_Pit |
| Stage | The stage value of the source of the material records, either defined on the model, or with the Stage Override (see Configuration for more information on Stage Override). |
South A |
| StandingTime | The sum (stated in seconds) of all time spent by a truck to move material from one destination to another when it is not moving. This includes Waiting (Queue), Loader Spot, Dump Spot, Dump, and Load. |
2452 |
| Total_mass | The mass of the material that was moved. | 14000 |
| TruckFleet | The name of the truck fleet. | CAT 795F |
| TruckInstanceCount | The number of trucks that were assigned to a task, divided by the proportion of the day that was covered by the step. For example, an allocation of 4 trucks over 12 hours would be an instance count of  . . |
2 |
| Volume | The volume of the material that was moved. | 12000 |
| Week | The week of the year that the step started in, stated in the range 1–52. | 13 |
| Year | The year that the step started in, formatted as YYYY. | 2024 |
ActivityTable
The ActivityTable contains the records of what each piece of equipment did over each time step. Each equipment will only have a single entry in this table at any point in time, and will include appointments that force an equipment to become unavailable. You can add activity reporting items and the default items that Epoch populates in the ActivityTable by entering the required data in the ![]() Reporting Fields subtab (see Reporting Fields for more information).
Reporting Fields subtab (see Reporting Fields for more information).
The table below shows the default attributes that you can include in the ActivityTable.
| Reporting attribute | Description | Example value |
|---|---|---|
| Activity | The activity being worked on. | Drilling |
| Bench | The bench of the solid that the equipment is working in. | B_240 |
| Date | The date that the step started in, formatted as YYYY-MM-DD. | 1993-05-07 |
| Day | The day of the month that the step started in, stated in the range 1–31. | 28 |
| Description | A description of what the equipment was doing. This includes the name of the appointment if the equipment has an appointment scheduled in the calendar. |
Scheduled Maintenance |
| Duration | The time during which the equipment was performing a given activity. | 24 |
| Equipment | The name of the primary equipment used. | Drill A |
| Fleet | The name of the fleet of the primary equipment used. | Drill Fleet |
| IsMaterial | Indicates if the activity results in producing the material. The value can be either Material or No. |
Material |
| Month | The month of the year that the step started in, stated in the range 1–12. | 5 |
| Period | The reporting period that the records were generated within. | 3 |
| Solid | The name of the solid that the equipment is working in (either the name of a pit solid or stockpile solid). | South_A_220 |
| Source | The name of the source that the equipment is working in (either the name of a pit or stockpile). | South_Pit |
| Stage | The stage value of the source of the material records, either defined on the model, or with the Stage Override (see Configuration for more information on Stage Override). |
South_A |
| Week | The week of the year that the step started in, stated in the range 1–52. | 14 |
| WorkType | The state of the equipment. The value can be either Working or No Task. | Working |
| Year | The year that the step started in, formatted as YYYY. | 1999 |
Adding, saving, and loading pivot reports
You can add a new pivot report, save your reports and load previously generated reports by clicking the following buttons:
|
|
Add a single report layout to configure in the Live Dashboard. Toggle between the reports by clicking on them. 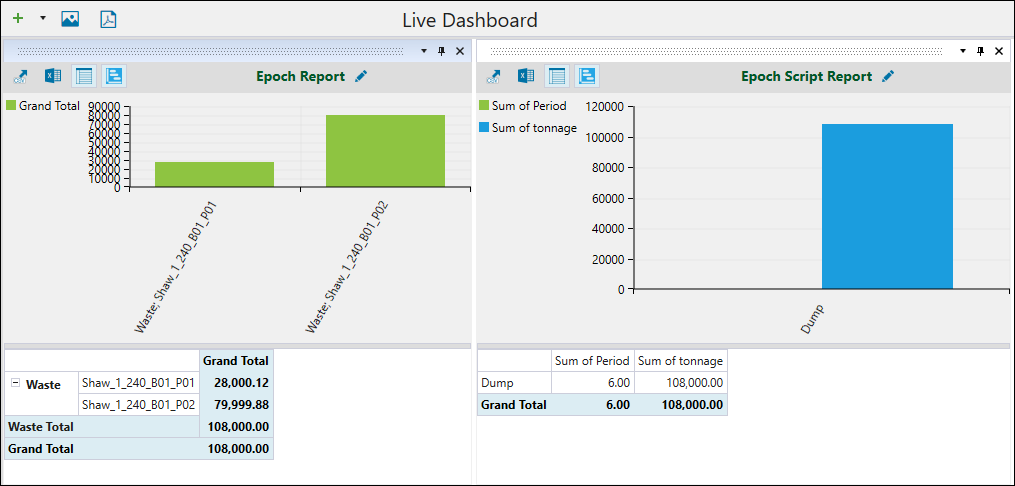 |
|
|
Add multiple report layouts to configure in the Live Dashboard. |
|
|
Save the current report layout as a PNG image file. After clicking this button, name the file and specify the location under which it should be saved. Click Save to confirm. |
|
|
Save the current report layout as a PDF file. After clicking this button, name the file and specify the location under which it should be saved. Click Save to confirm. |
|
|
Load a previously created dashboard layout. |
|
|
Save the current dashboard layout. After clicking this button, choose a name for your dashboard layout and click Save to confirm. |
|
|
Copy the current report to clipboard. |
|
|
Export your report to an Excel file. |
|
|
Toggle the visibility of the pivot table. |
|
|
Toggle the visibility of the pivot chart. |
|
|
Change the name of your pivot report. |
