Python Report Scripting
Source file: python-report-scripting.htm
Python report scripting in Evolution allows you to create custom scripts to evaluate your schedules and build your reports. While pivot reports allow you to visualise your data in basic cases, Python report scripts make it possible to compile and generate reports for more complex mining scenarios. For more information on pivots, see Pivot Reporting.
The python report scripts run over a series of groups and aggregate their values to write to a report, whereas the maths scripts run over individual blocks or solids and modify their attribute values. See Applying a Maths Script for more information on maths scripts.
You can create report scripts in Python for the following:
-
Solid models
-
Block models, where each report item is a single block.
-
Origin Blocks schedule, where each report item is a parcel item (based on rows in the CSV file when you right-click on the schedule and select the
 Export Schedule to CSV option).
 -
Strategy schedule, based on the Mine Sequence Report records.
Once you compile your Python report, you can export it outside of Evolution.
Note: The required Python version is built-in to the Evolution package.
Creating a report script in Strategy, Origin Blocks, and Origin Solids
To generate a report script, click on the ![]() (Add Report Script) icon in the project explorer toolbar.
(Add Report Script) icon in the project explorer toolbar.
A new file named Report Script will be instantly added to the list of files in the project explorer and opened in your viewer.
Tip: To rename your script, right-click on the file in the project explorer.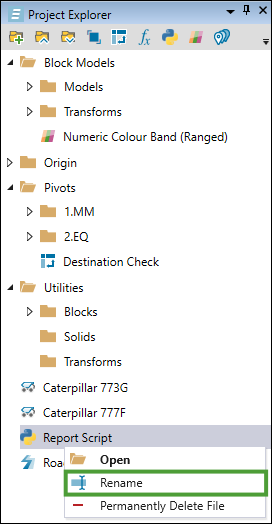
To add a data source to your report script, drag a model or a schedule from the project explorer into the report script window.
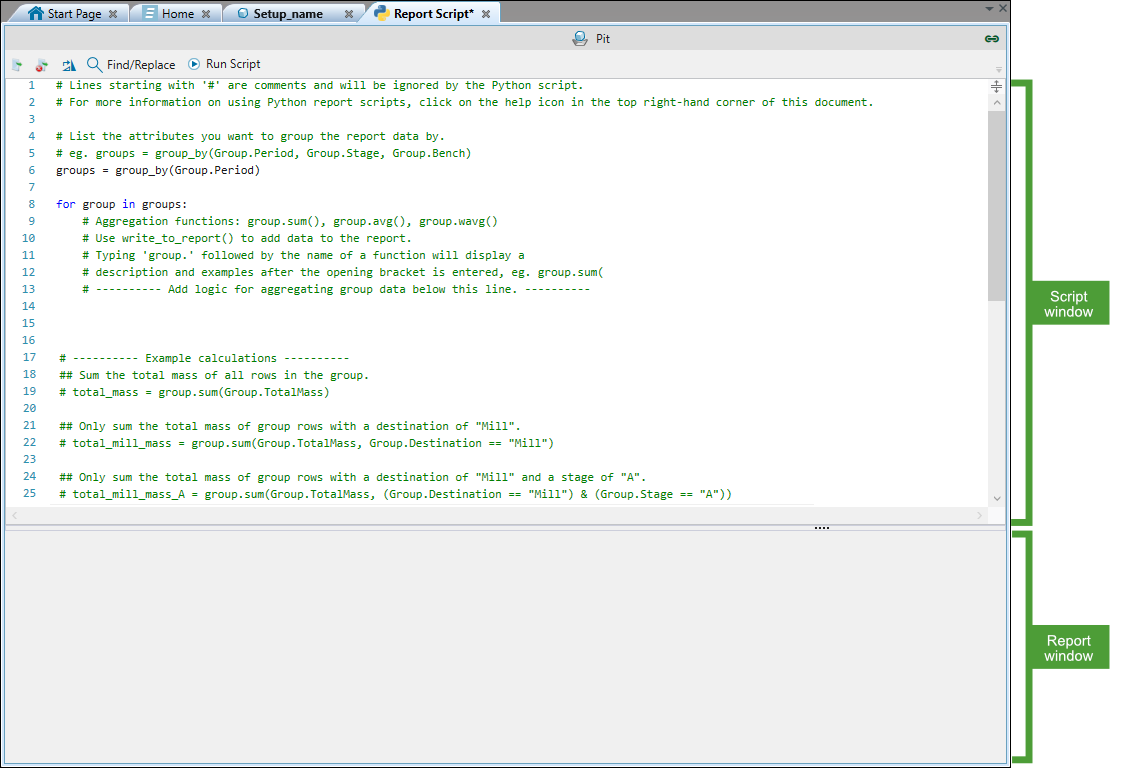
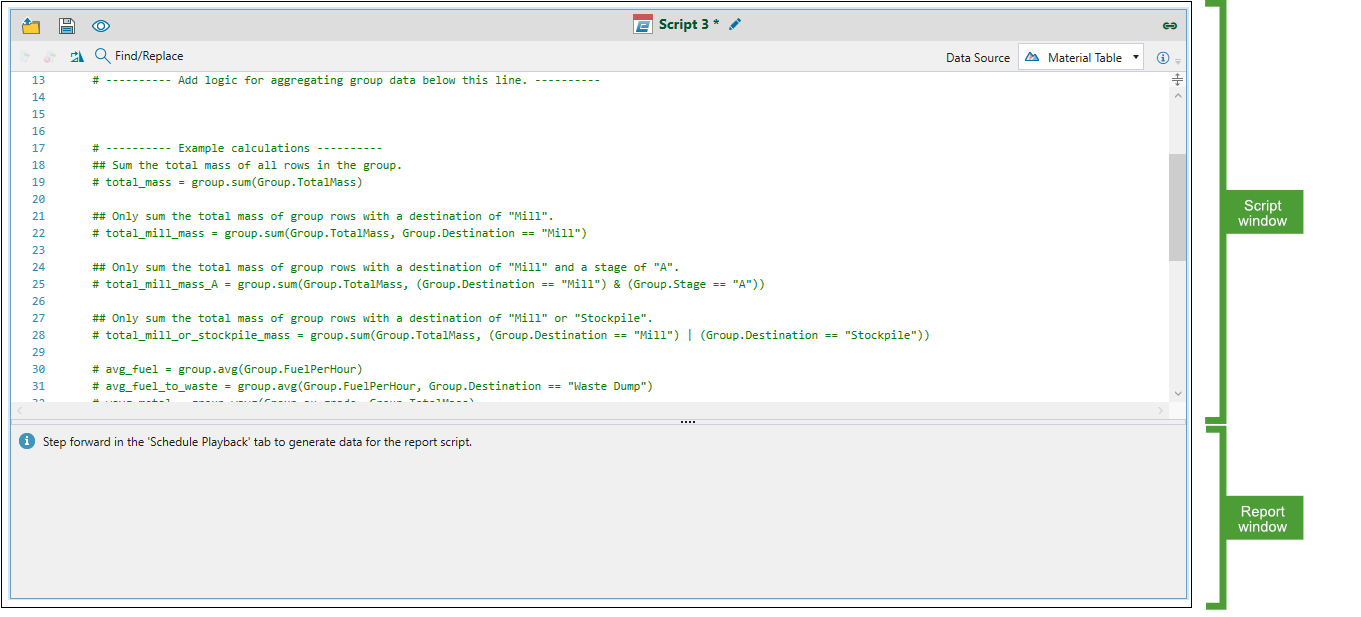
The script report screen is divided into two parts: the Script window (where you can apply your script), and the Report window (where the output for your report will be shown).
You can change the way your script report is displayed by clicking the following buttons:
-
 (Change orientation) in the script window: Allows you to switch between horizontal and vertical orientation of the report panel.
 Vertical layout 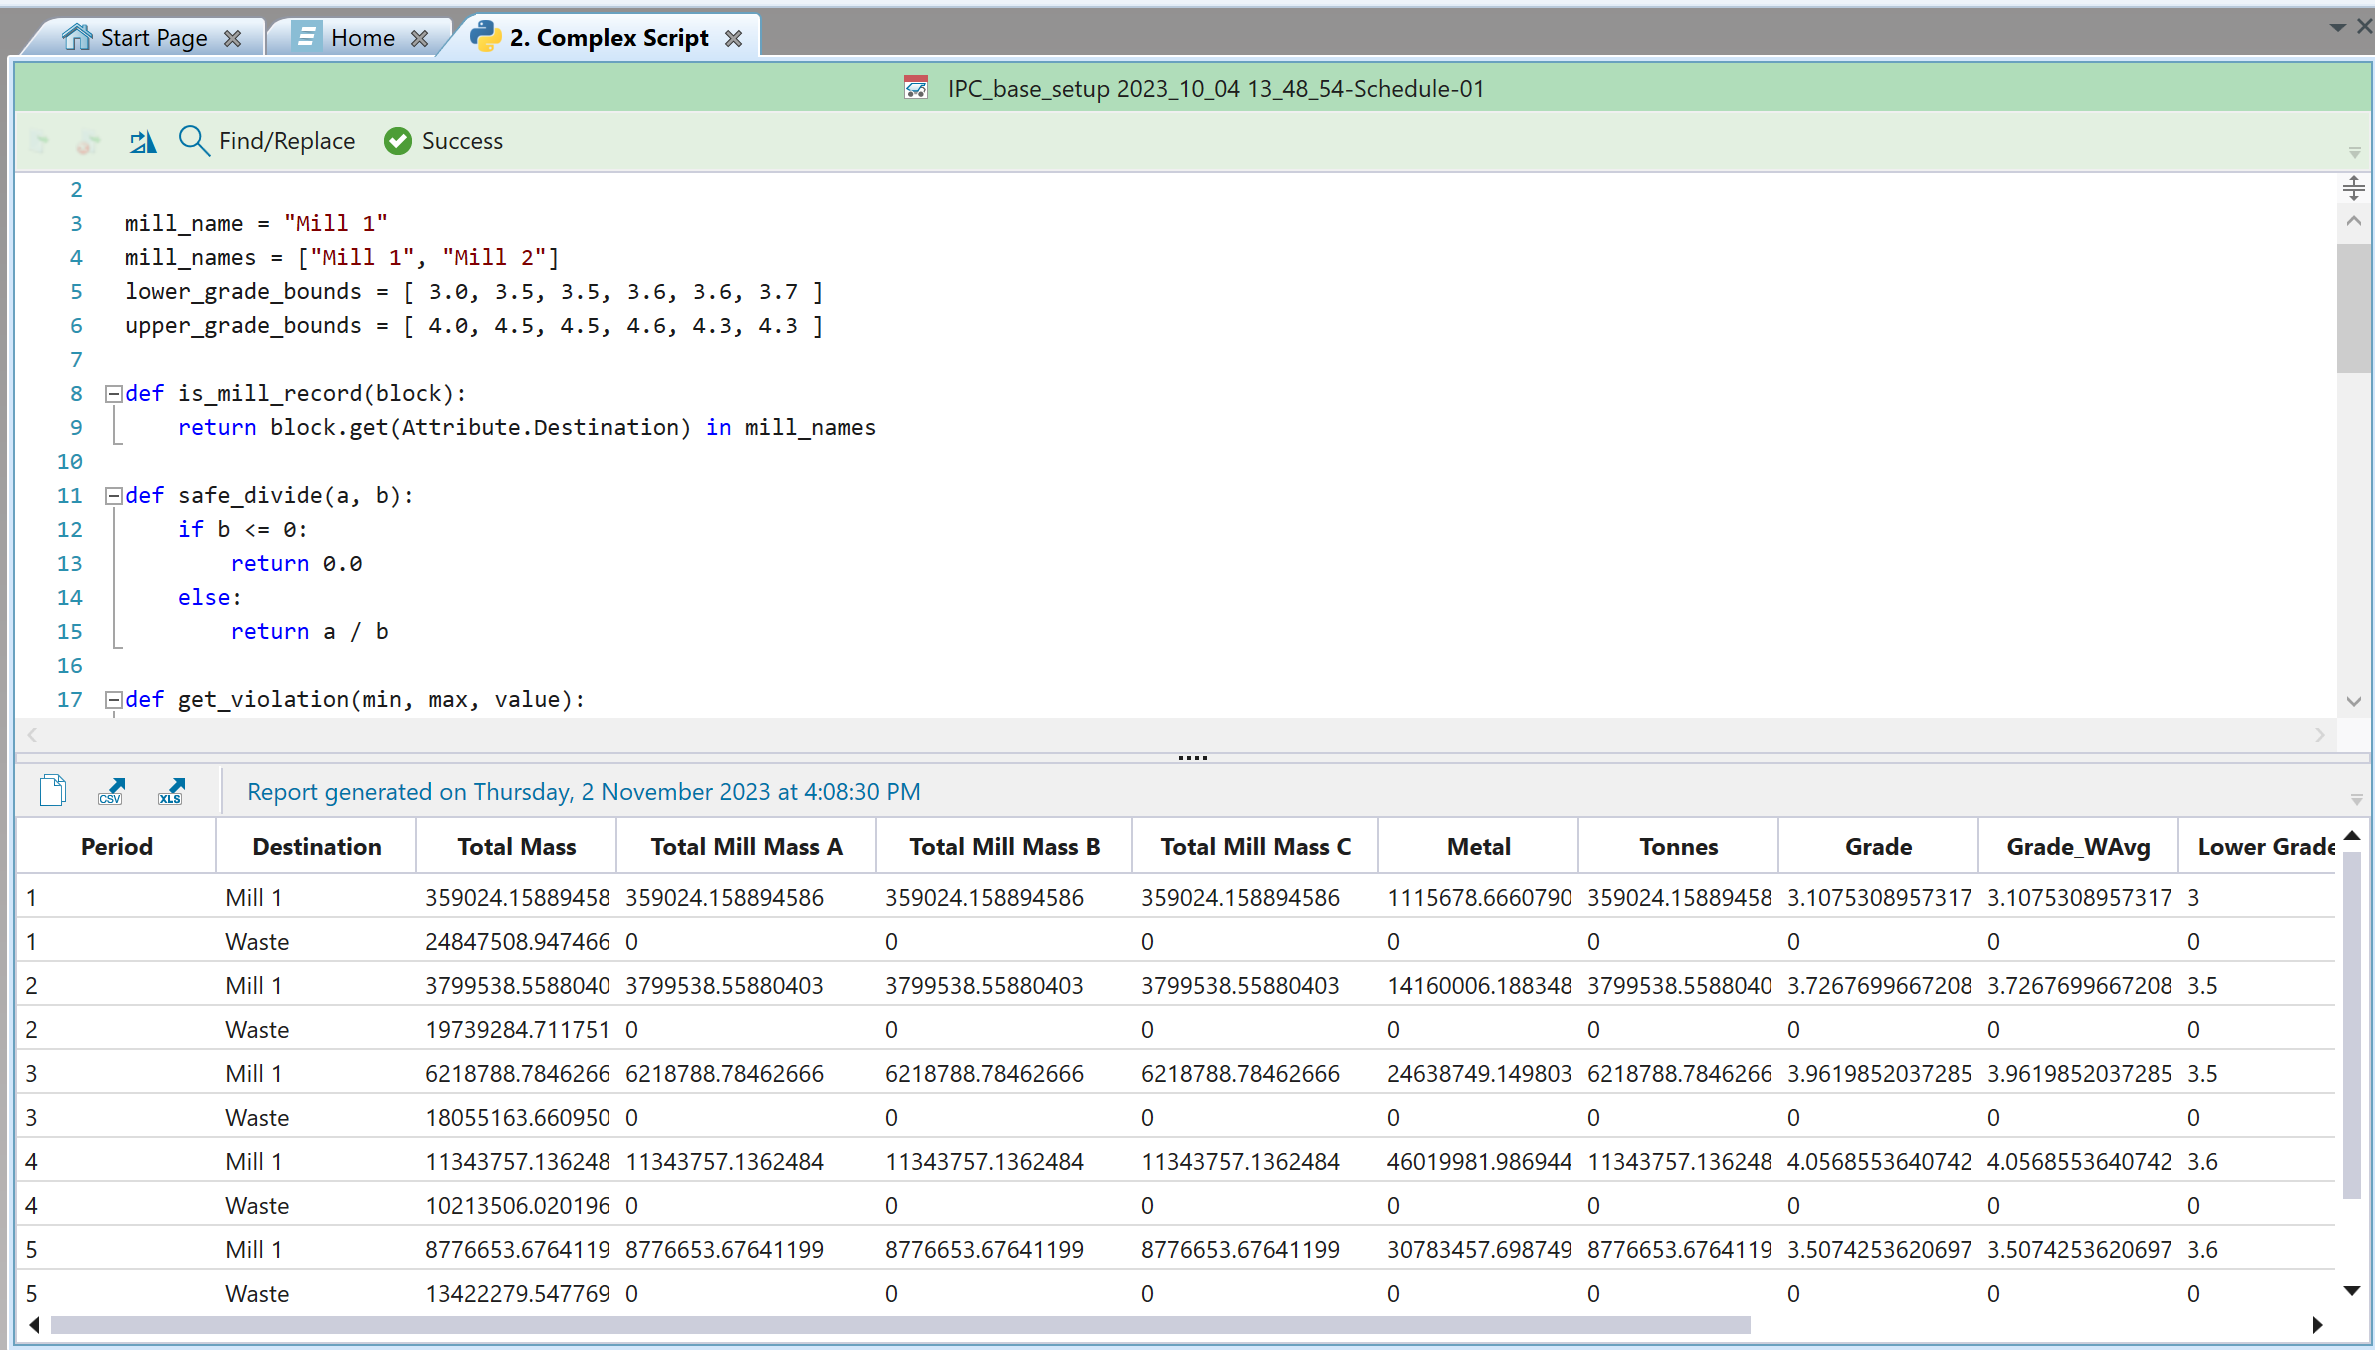
Horizontal layout 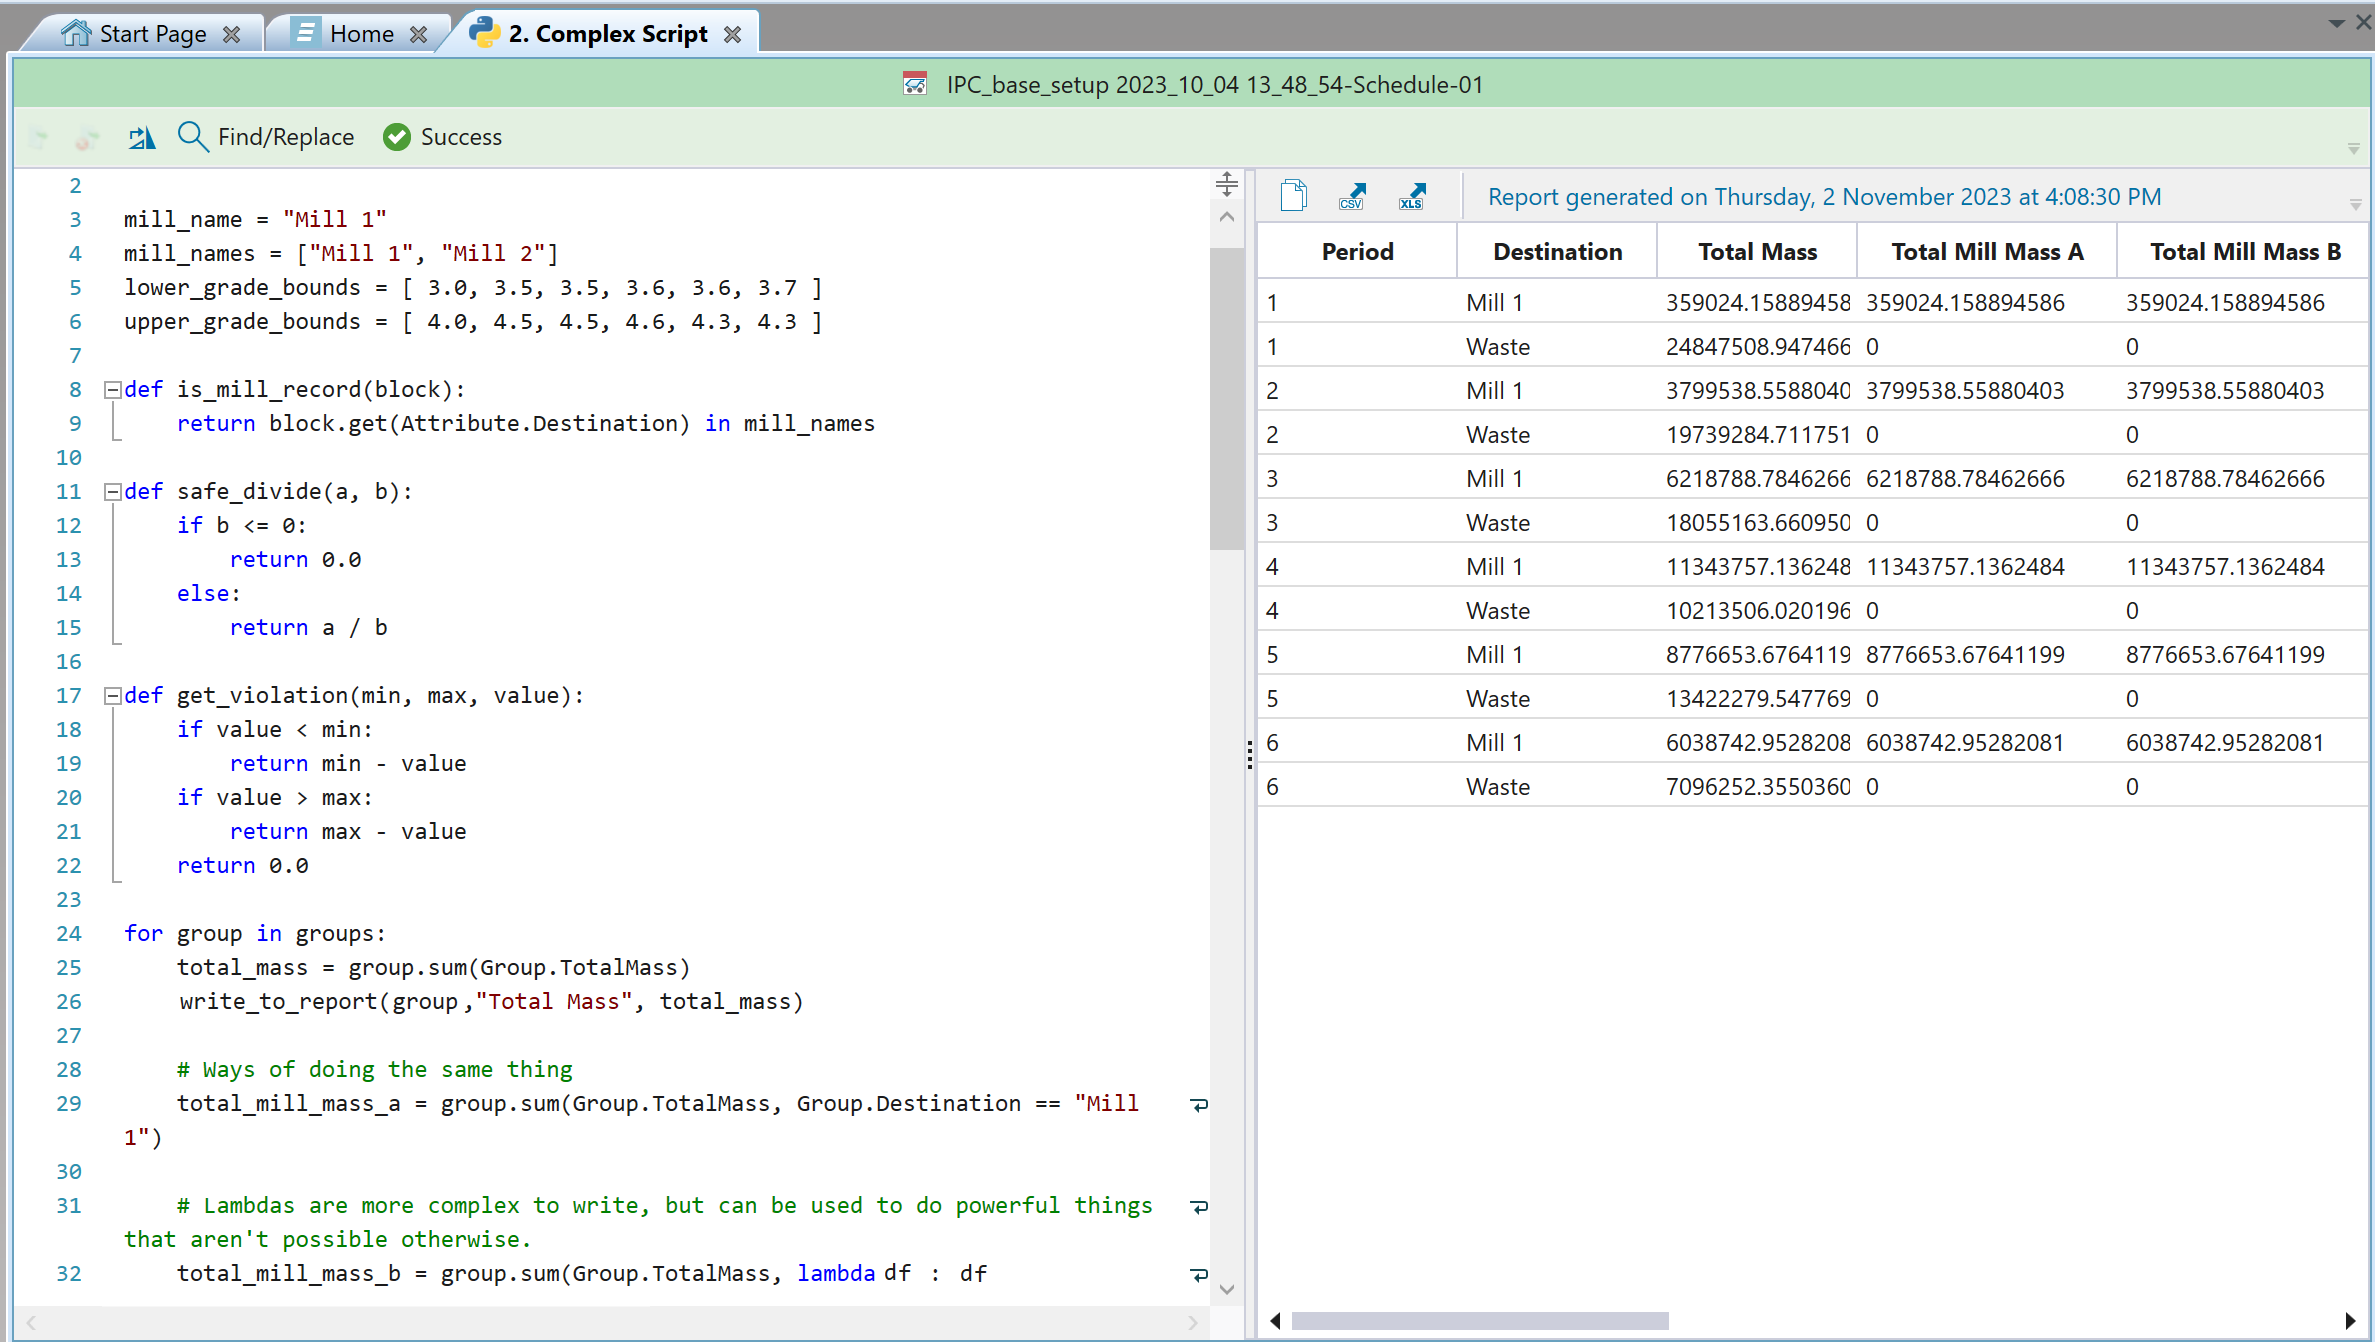
-
(Flip rows and columns) in the report window: Allows you to switch the position of the rows and columns in the report script result.
Note: The button will appear once you generate your script report.
Default layout 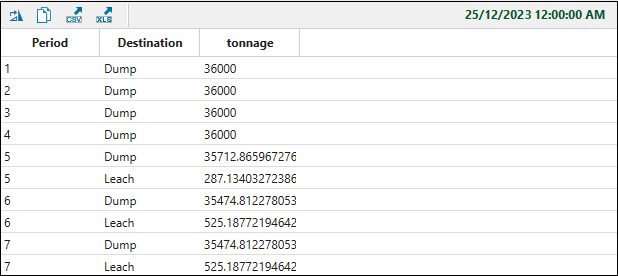
Flipped rows and columns 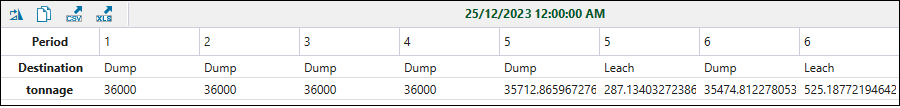
Creating a report script in Epoch
Similarly to other modules, you can also create report scripts in Epoch, however the report script creation path is slightly different. This is because the result generated from an Epoch report script will live update each time you step through your schedule.
To open the script entry screen in the Epoch module, go to the ![]() Viewer tab and enter the Schedule Playback tab at the bottom of the screen.
Viewer tab and enter the Schedule Playback tab at the bottom of the screen.
Next, select ![]() Script from the Reporting tools.
Script from the Reporting tools.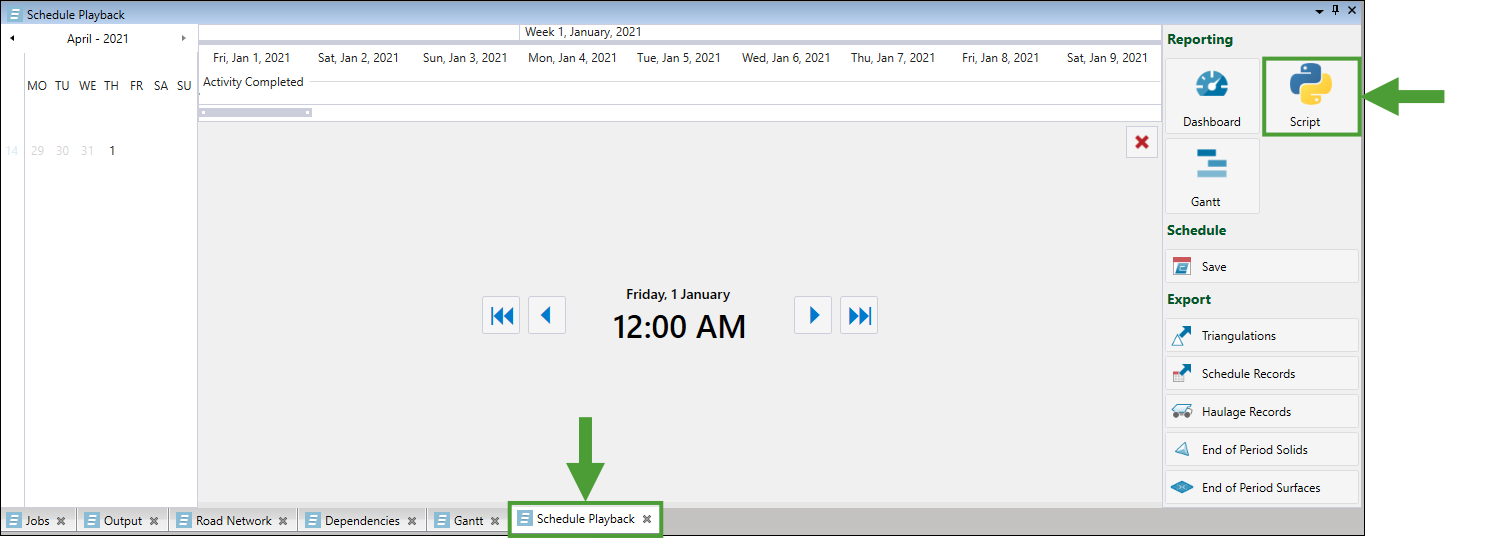
The Open Report Script panel will appear. You can open a previously created report script by selecting it from the list and clicking Open, or create a new script by clicking New. To delete a previously created script, click the ![]() button corresponding to the script you wish to delete.
button corresponding to the script you wish to delete.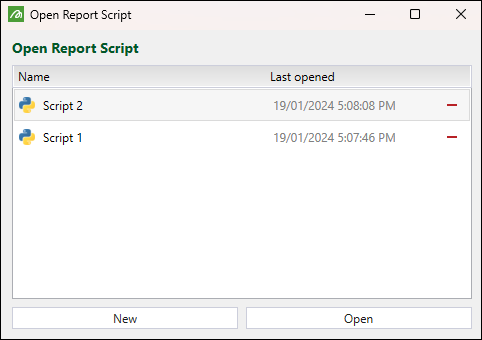
The script report screen is divided into two parts: the Script window (where you can apply your script), and the Report window (where the output for your report will be shown).
-
Click the
 (Load report script) button to open another previously saved Epoch report script or to create a new report script for the given setup.
 -
Click the
 (Save report script) button to save the script you have created.
 -
Click the
 (Toggle report script editor visibility) to hide the script from your view so that only the generated report will be displayed. See Python report generation in Epoch for more information.
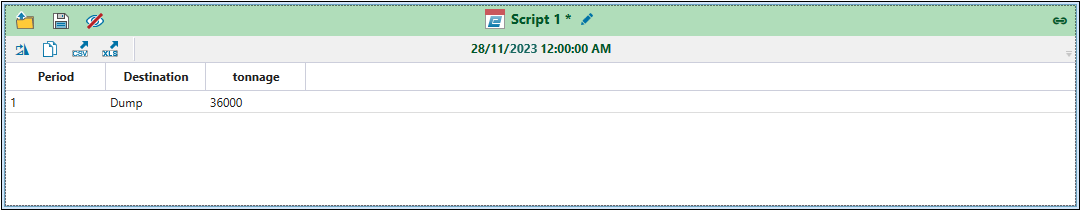
-
Click on the name of your script or the
 (Edit report script name) button to rename the script. To save the newly entered script name, press Enter or click outside the script name field.
Note: The default name of the newly created report script follows the name of your setup.
-
Specify the data source for your script report by selecting either
 Material Table or
  Activity Table from the drop-down menu. Material Table
Contains all records of material generated from activities with output parcels. Activity TableContains all records for each piece of equipment during the schedule. -
Click the
(Change orientation) button to switch between horizontal and vertical orientation of the report panel. See Creating a report script in Strategy, Origin Blocks, and Origin Solids for an example layout view.
Report attributes
The default template of your newly added report script will contain the information on the attributes you can include in your custom report.
The basic function you can apply is group_by(*attributes), which groups the rows of a data source based on their values for one or more selected attributes.
For example, you can group your data by the following attributes:
-
Period, by applying the
group_by(Group.Period)function. -
Stage, by applying the
group_by(Group.Stage)function. -
Bench, by applying the
group_by(Group.Bench)function.
Note: You can include multiple grouped items in your report. For example, you can add grouping by period and by stage by typing the group_by(Group.Period, Group.Stage) function.
To include comments in your Python script, do one of the following:
-
Press
 (Comment out the selected lines).
 -
Use the keyboard shortcut Ctrl + K.
-
Start the line with a #.
The lines starting with # will be ignored during output generation.
To remove comments from the selected lines, do one of the following.
-
Press
 (Uncomment the selected lines).
 -
Use the keyboard shortcut Ctrl + U.
-
Manually delete the # from the selected lines.
Data aggregation
The supported aggregation functions are as follows:
-
group.sum(value_expression, filter): Sums the group's values for the given expression. -
group.avg(value_expression, filter): Averages the group's values for the given expression. -
group.wavg(value_expression, weight_expression, filter): Calculates the weighted average of the group's values for the given expression, weighted by the given weight. -
write_to_report(group, column_name, value): Allows you to add a value to the report, under the given column name. -
group.min(value_expression, filter): Returns the minimum of the group's values for the given numeric expression. -
group.max(value_expression, filter): Returns the maximum of the group's values for the given numeric expression. -
group.mode(value_expression, filter): Returns the mode of the group's values for the given numeric or text expression.
Note: Use the write_to_report() function to put the calculated values into your report.
The filter allows you to evaluate the content to true and false value. If it returns true, the group item will be included in the aggregation function, otherwise it will be ignored.
The examples below show three ways of grouping parcel tonnes to be sent to the destination (Mill 1).
Simple filtering using a group attribute
# In this example, the filter is: Group.Destination == "Mill 1"
# Note that this syntax is a shortcut and can only be used for basic operations. If you want to use more complicated filtering logic, you will need to use one of the other two methods.write_to_report(group, "Mill Mass", group.sum(Group.ParcelTonnes, Group.Destination == "Mill 1"))
Using a function as a filter
# Function that takes in a row and returns true if its destination was the mill.def filter_mill(dataframe):
return dataframe[Attribute.Destination] == "Mill 1"
# The function name, filter_mill, is passed into the function as a filter.write_to_report(group, "Mill Mass # 2", group.sum(Group.ParcelTonnes, filter_mill))
Using a lambda as a filter
# In this example, the filter is: lambda row: row.get(Attribute.Destination) == "Mill 1"write_to_report(group, "Mill Mass # 3", group.sum(Group.ParcelTonnes, lambda df:
df[Attribute.Destination] == "Mill 1" ))
Tip: Lambda functions can be used in-line in place of a regular function.
Combining filter expressions
Note: The following examples show summing the tonnage of all records where the bench is greater than 20 and less than 70.
| AND: (expression1) & (expression2) |
group.sum(Group.Tonnage, (Group.Bench > 20) & (Group.Bench < 70)) |
| OR: (expression1) | (expression2) |
group.sum(Group.Tonnage, (Group.Bench < 20) | (Group.Bench > 70))
|
Note: You must insert the brackets to surround each expression.
Code autocompletion
To facilitate the code input, a context-aware code completion feature named Intellisense has been implemented in the report script editor. Once you start inputting a name of a function in the script window, a list of suggested function names will be displayed for you to select.
The image below shows the list of functions provided when you input group.
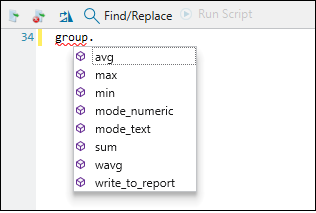
Context-aware code completion can also provide a description of operations that are executed based on the input code.
The image below shows the description provided when you input group.sum(): 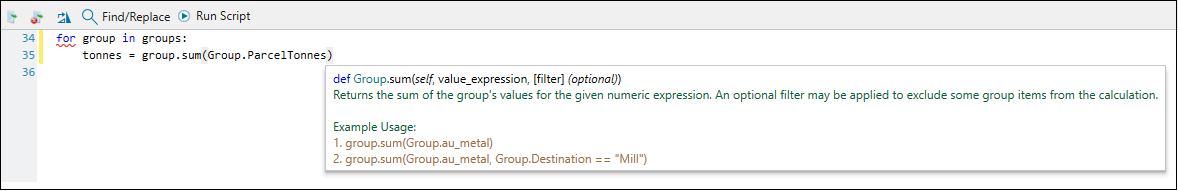
Python report generation in Strategy, Origin Blocks, and Origin Solids
Once you finish applying the script in the Script window, click ![]() Run Script to generate the output for your report.
Run Script to generate the output for your report.
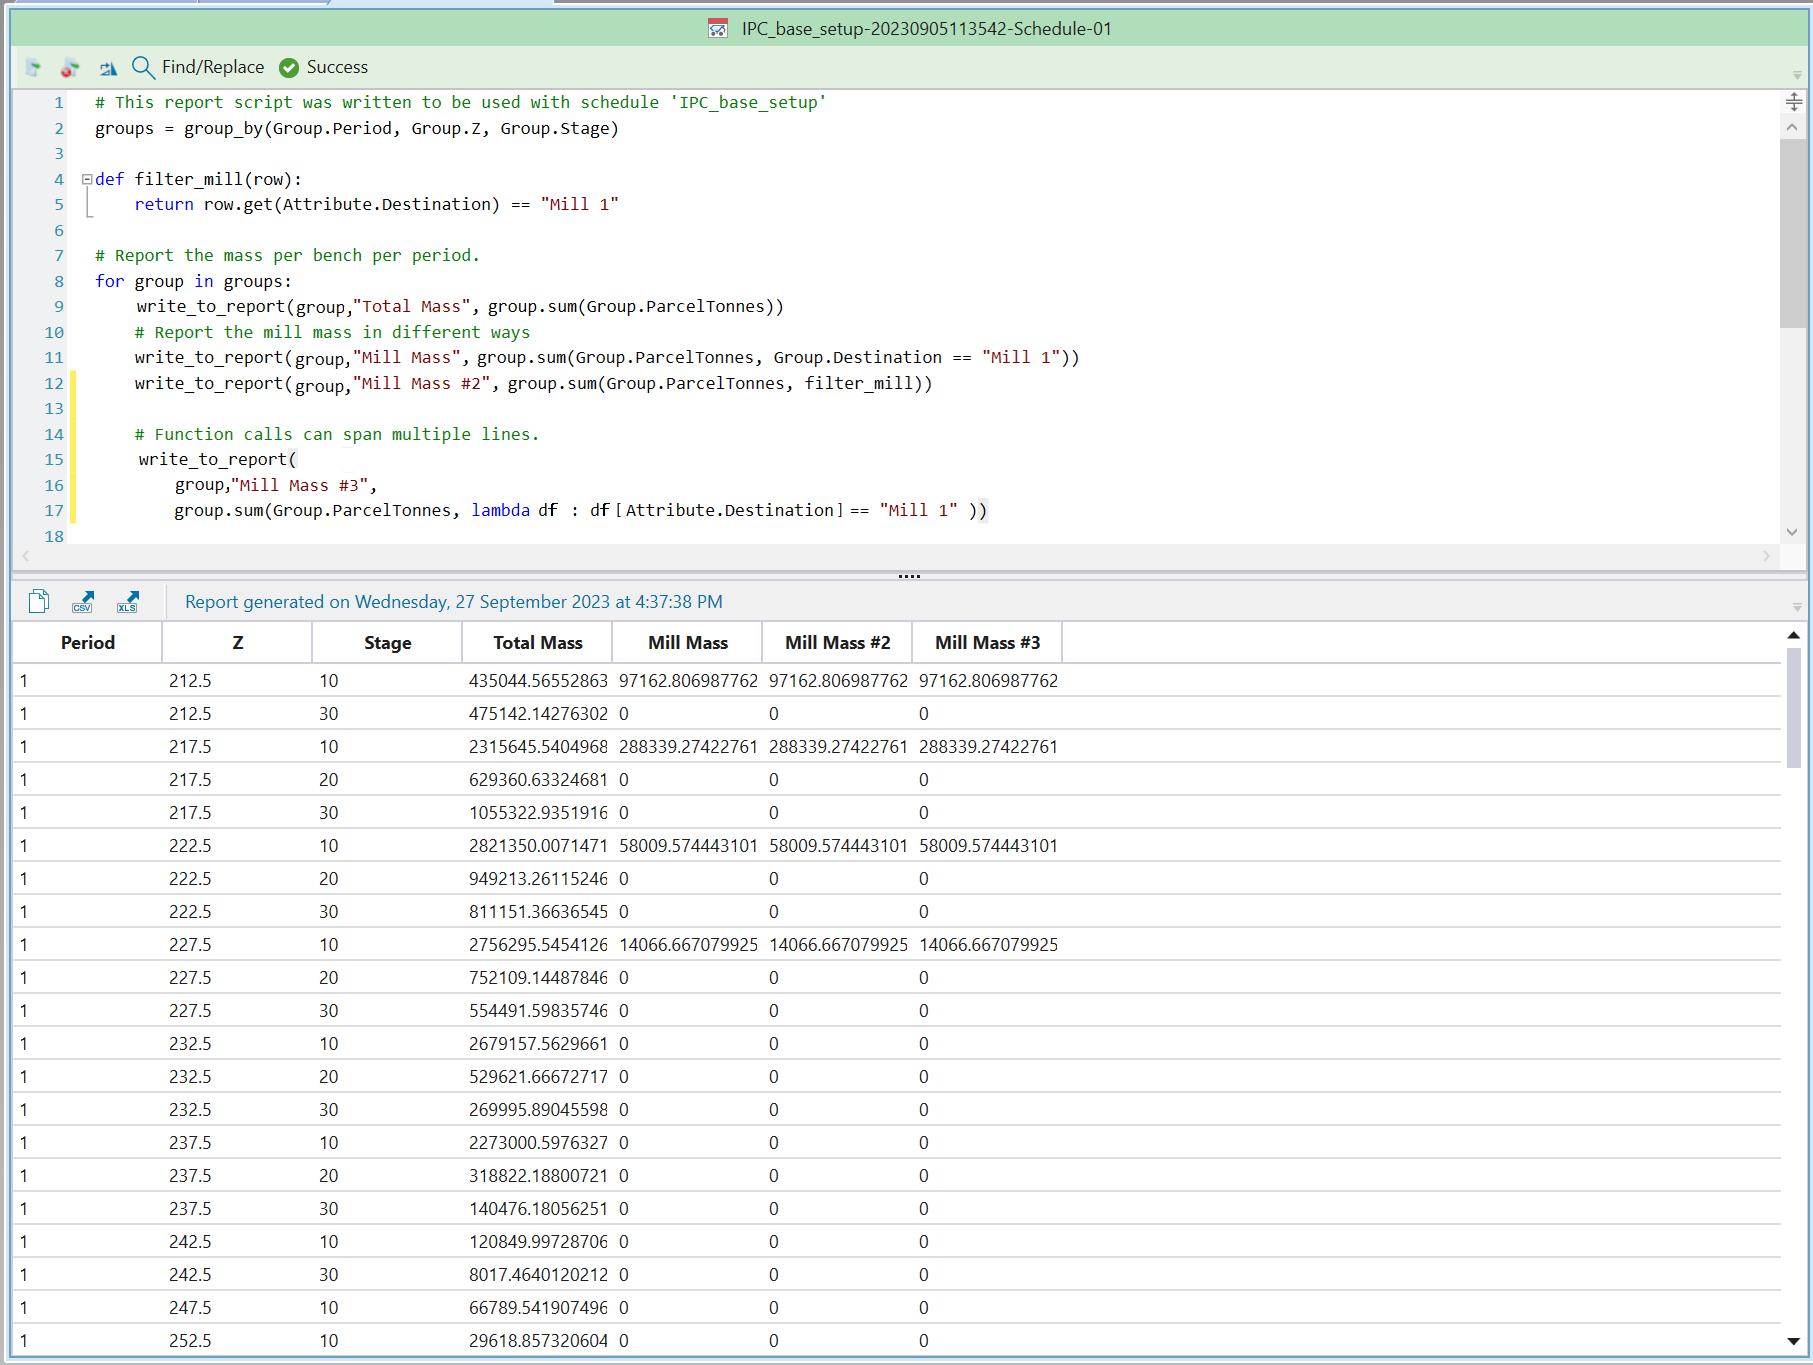
The image below shows an example Python script and a resulting report.
Python report generation in Epoch
To display your output report, step forward in the Schedule Playback window by clicking the ![]() button.
button.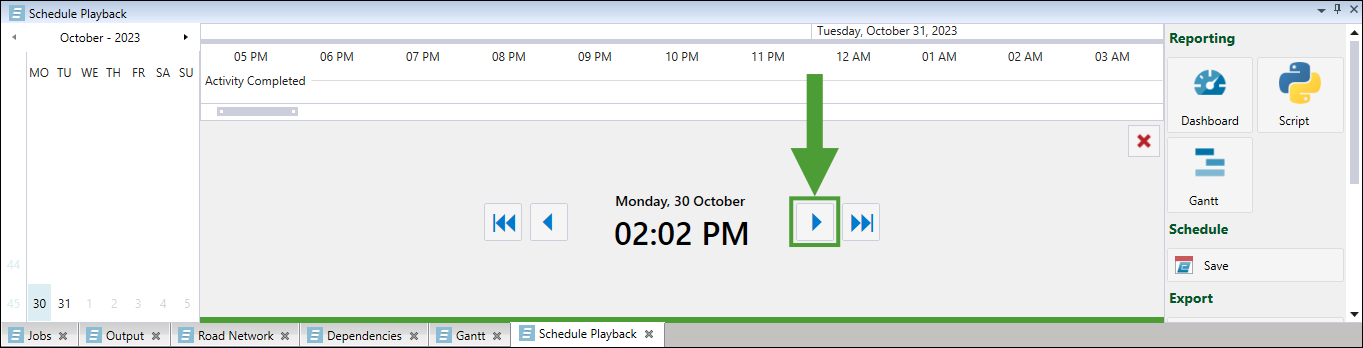
The report script result will update automatically as you step through the schedule:
| Example date from the schedule | Report script result |
|---|---|
| 28/11/2023 |
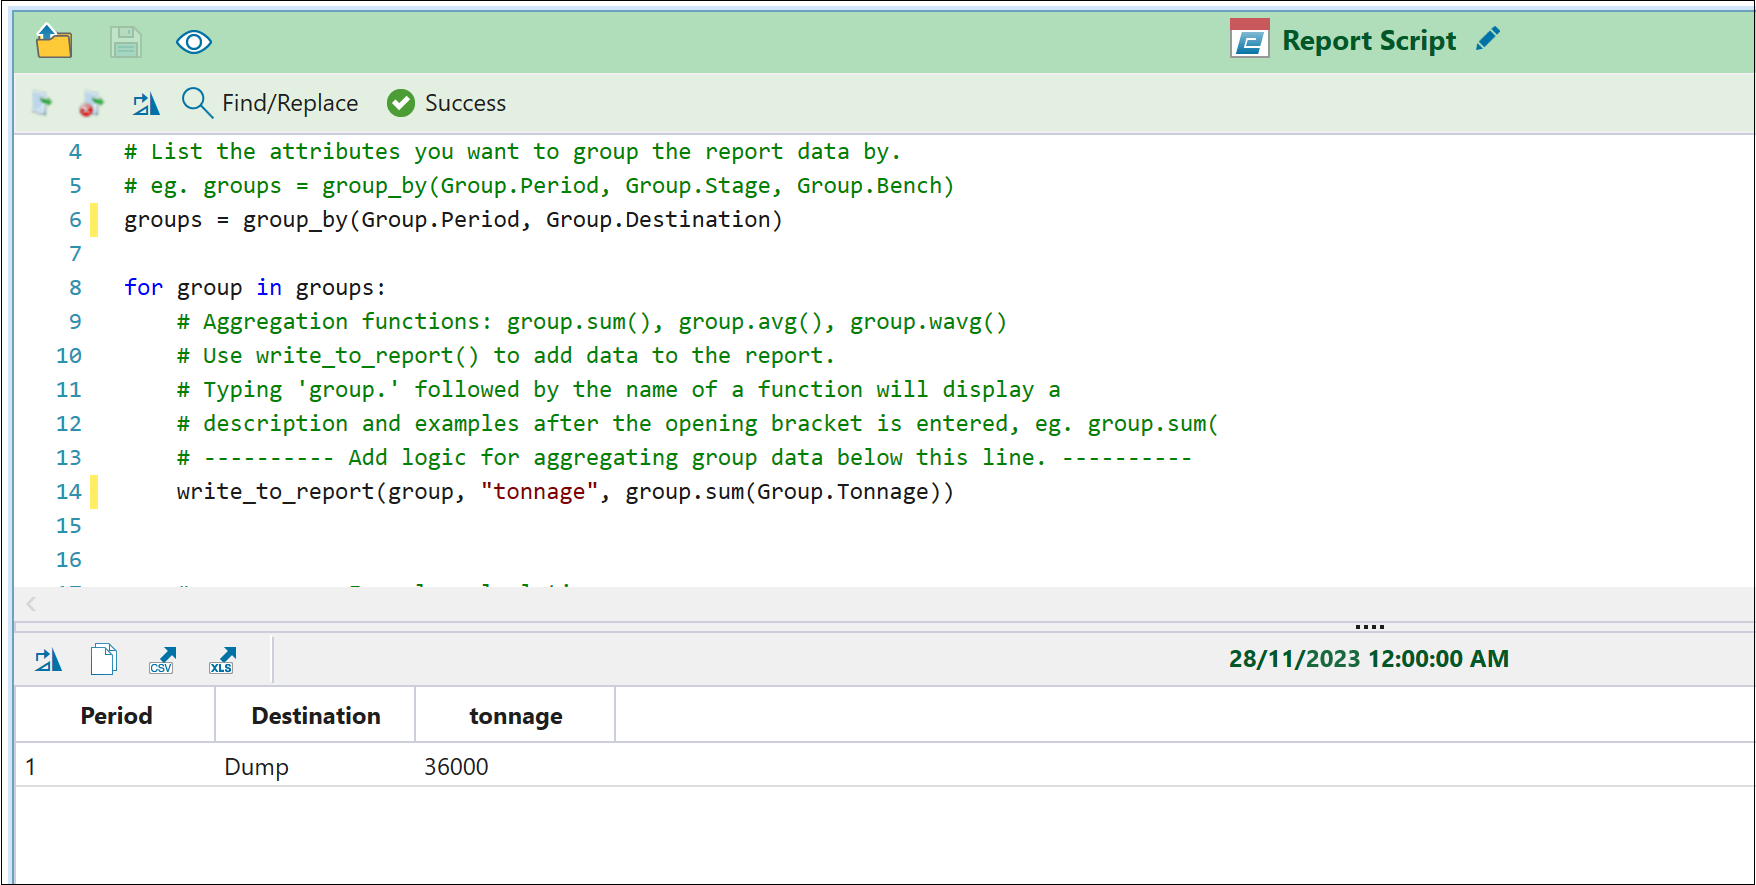
|
| 29/11/2023 |
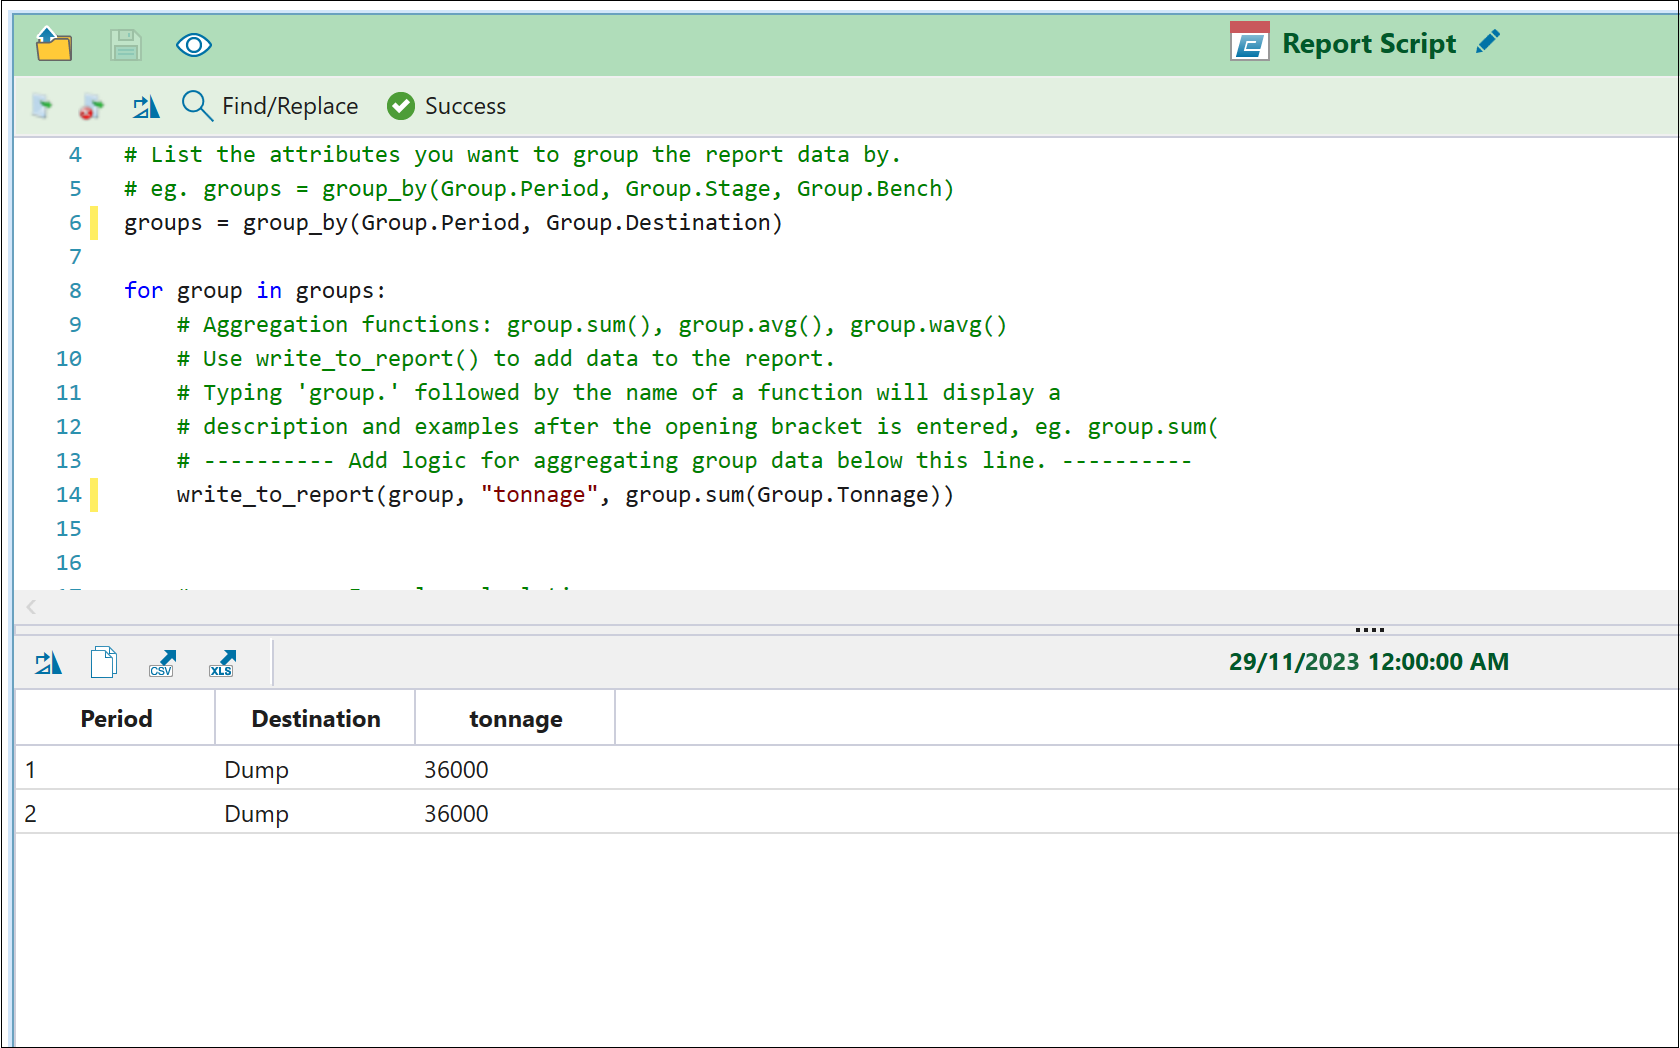
|
| 4/12/2023 |

|
You can also use your generated report as the data source for pivot reports. To do so, follow these steps:
-
Click
 Dashboard in the Schedule Playback window.
Note: Click
(Save report script) in the script window to use your script in the Dashboard.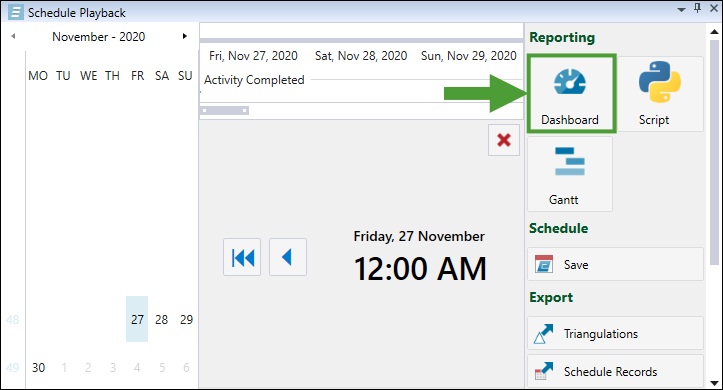
-
Open a previously created dashboard layout in the Open Dashboard Layout panel, or click New to create one.

-
In the Pivot panel on the right side of your screen, select
 Script as your data source and select the required script from the drop-down menu.
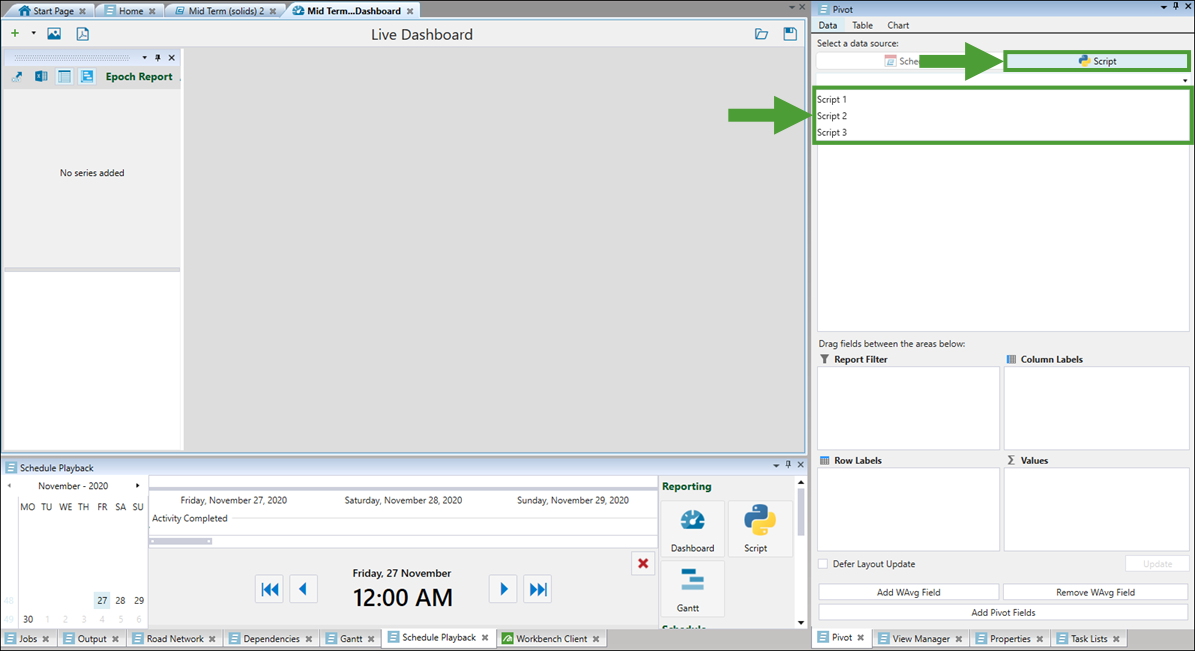
-
Select the fields to be included in your pivot report.
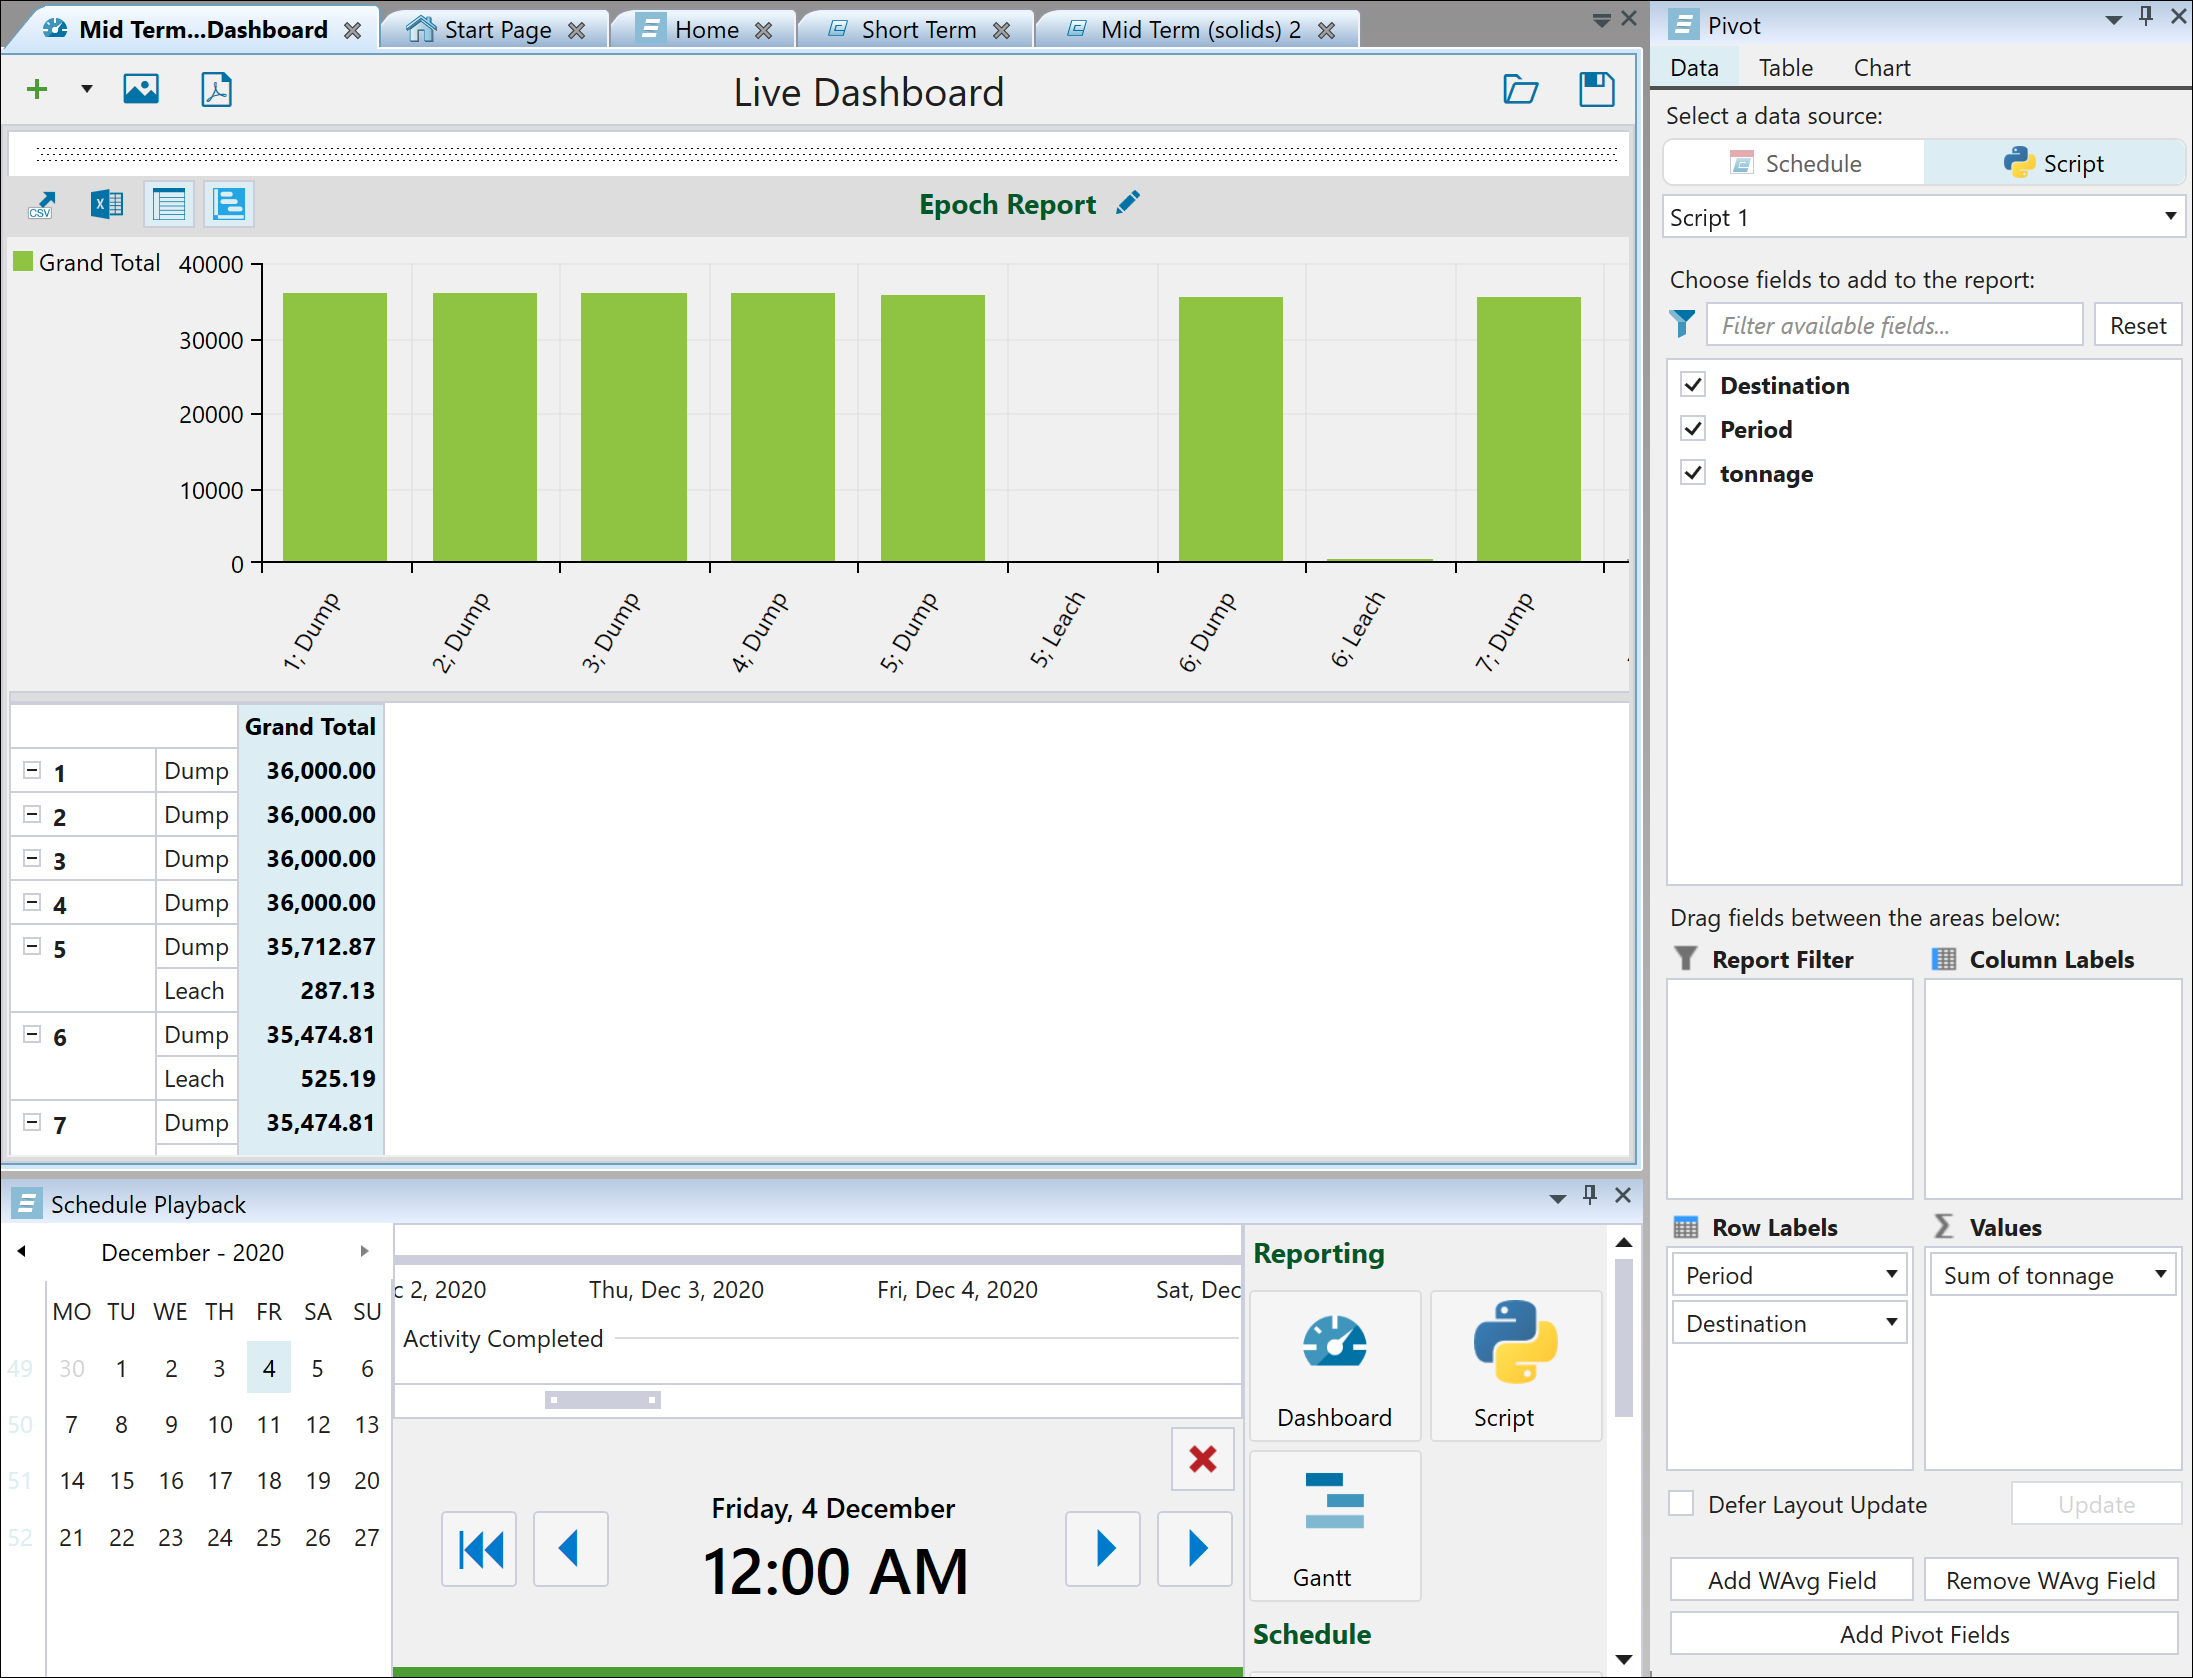
See Live Dashboard and Pivot Reporting for more information.
