CAD
The following table describes the tools in the CAD section of the Create tab.
| Tool | Description |
| Points | Creates points to manipulate or add to existing data. |
| Line | Creates lines to manipulate or add to existing data. |
| Grid | Creates a point grid across an area defined by a polygon. |
| Polygon | Creates polygons to define a boundary. |
| Smart Line | Creates smart lines to track along the edges of data. |
| Freehand Line | Creates a line that corresponds to the movement of the mouse cursor |
| Fitted Line | Fits a line to a selection of points. |
Points
Points may be created to manipulate or add to existing objects.
-
Select Create > CAD > Points.
![]()
-
On the status bar, enter the First point, or click in the View window.
-
Enter more points, as required.
-
Click Complete or press ENTER. The points become one object and are saved in the cad container.
Note: Create points while in top view or use snap modes to ensure the points are created in the intended location.
Note: Hold Shift while digitising to create points at a fixed Z value.
Line
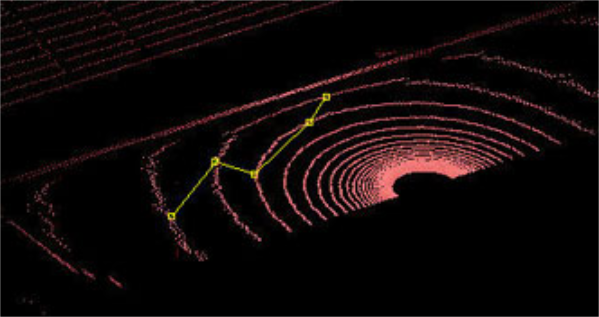
Lines (F9) may be created to manipulate or add to existing objects.
-
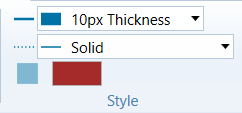
Select the desired line thickness and line style using the Create > Style toolbar.
-
Select Create > CAD > Line.

-
On the status bar, enter the First point, or click in the View window.
-
Enter more points, as required.
-
Click Complete or press ENTER. The line is saved in the cad container.
Note: Create lines while in top view or use snap modes to ensure the lines are created in the intended location.
Note: Hold Shift while digitising to create points at a fixed Z value.
Grid
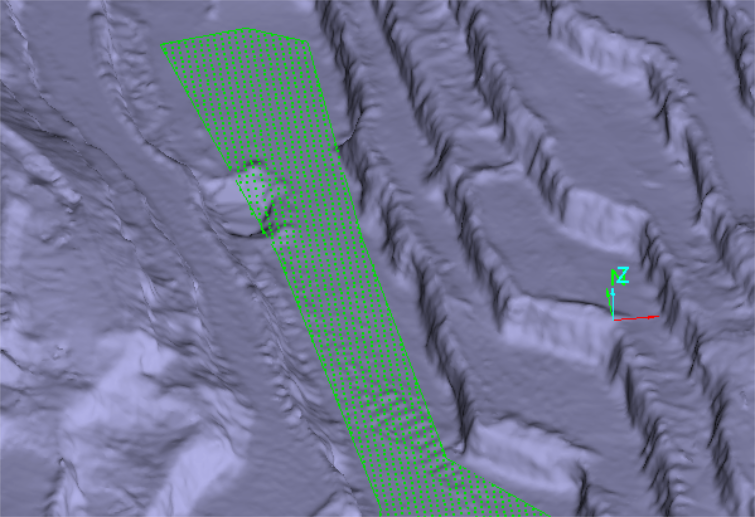
Draw Grid Creates a point grid across an area defined by a polygon.
Points can be used to generate points in a grid pattern fitted to a surface. This may be useful for creating spot heights.
Lines can be used to create a gridded surface at a defined spacing and alignment.
-
Select Create > CAD > Grid.
-
Enter the desired Grid spacing.
-
Select Points or Lines for the grid.
Points
-
If required, create a polygon around the area that requires a grid, then, click on the polygon in the View window to populate the Polygon field. Alternatively, points will be generated to cover the entire object.
-
Adjust the Projection direction if required.
-
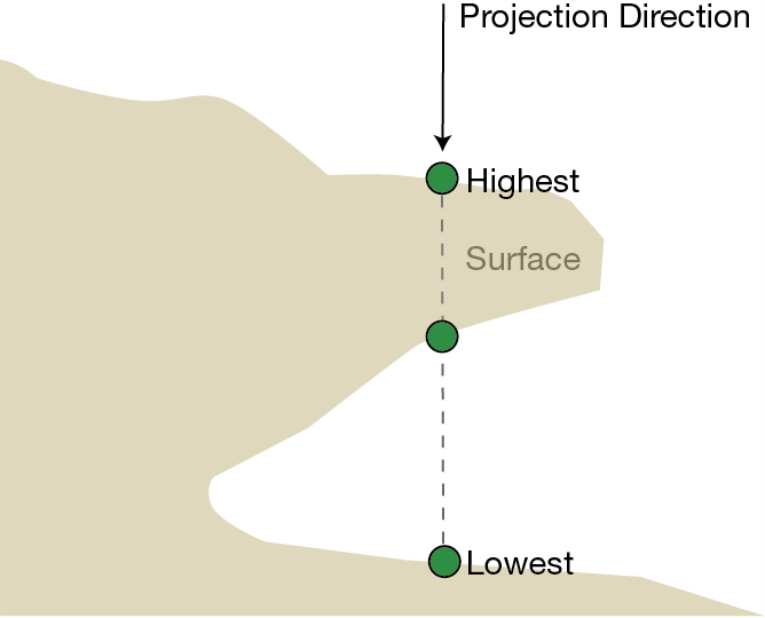
Select whether to generate All points fitted to the surface, the Lowest points, or the Highest points.
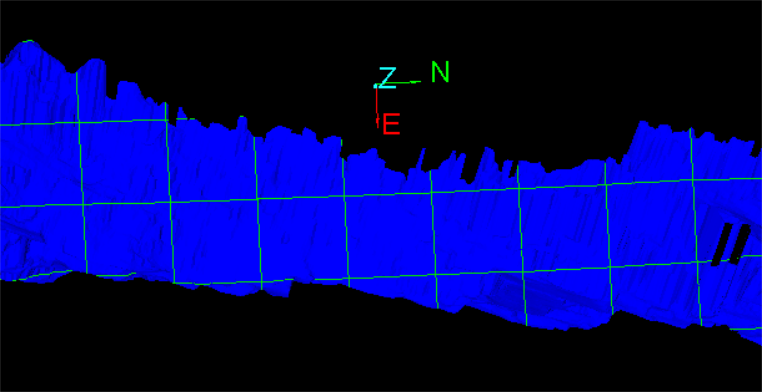
The example below shows the Highest and Lowest points that would be selected if there is overhanging data. Selecting All will generate all three marked points.
-
Highlight the triangulation (surface to fit the gridded points) in the Explorer window and click OK.
The grid is saved in the cad container.
Lines
-
Select the required Alignment for the grid. When specifying an alignment direction, only the XY component is taken into account so the grid is always projected in the Z direction.
The grid is saved in the cad container.
Polygon
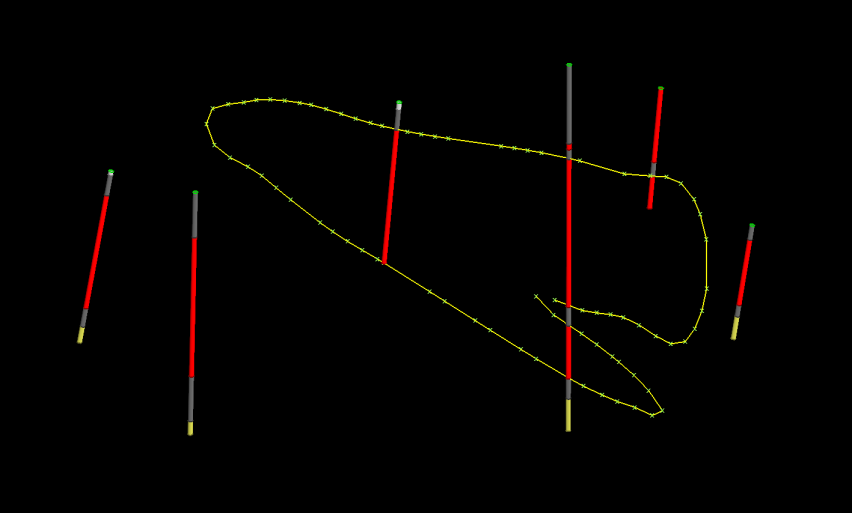
Polygons are closed lines or loops used to define a boundary. Polygons can be used to define areas of interest for modelling, filtering and cropping data.
-
Select Create > CAD > Polygon.

-
On the status bar, enter the First point, or click around the area of interest in the View window.
-
Click Complete or press ENTER. The polygon is saved in the cad container.
Note: Create polygons while in top view or use snap modes to ensure the polygon is created in the intended location.
Note: Hold Shift while digitising to create points at a fixed Z value.
-
If a filled polygon is required, select the polygon and choose Edit > Fill Polygon on the right-click context menu.
Smart Line
Smart line can be used to create lines that track along edges of objects.
Different data causes smart line to behave differently. When tracking along triangulations, the line tends to track along the intersection of near horizontal and near vertical facets, which is useful when extracting toes and crests. For coloured objects, including images, the smart line tracks coloured edges and extracts geological boundaries.
-
Select Create > CAD > Smart line.
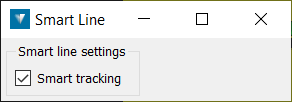
Deselecting Smart tracking disables smart line.
-
On the status bar, select the first point or click in the View window. Pick points close together to ensure the tracking covers all of the points.
-
Enter more points, as required.
-
Click Complete. Smart lines are saved in the cad container.
Freehand Line
Freehand line can be used to create lines that correspond to the movement of the mouse cursor on the screen.
-
Create > CAD > Freehand line. Click to indicate the start of the line and move the cursor to indicate the path of the line.
-
Left click to indicate a break between successive line objects.
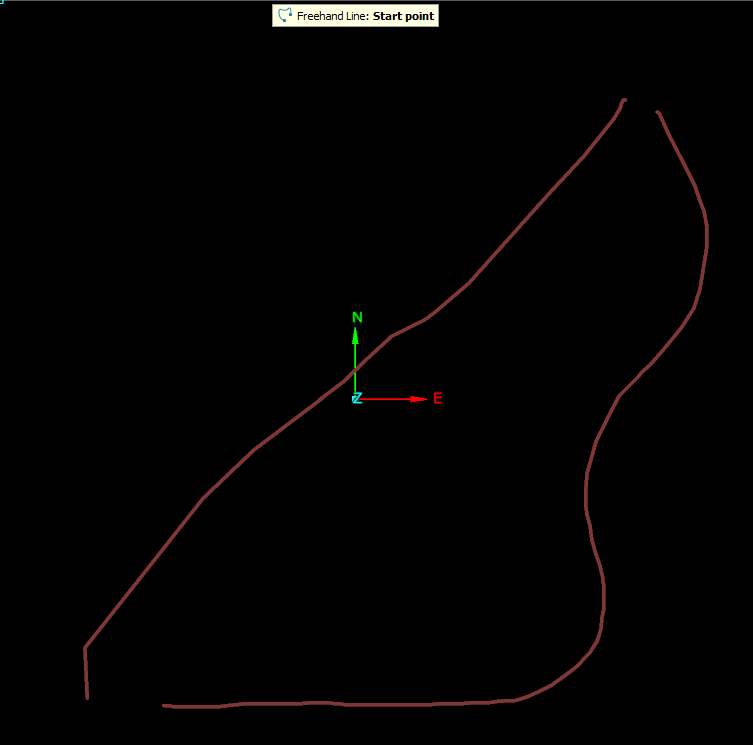
Example of two free hand line segments.
Fitted Line
Fitted lines are used to fit a line to a selection of points.
Using the point selection tool , select the group of points to have a line fitted.
-
Select Create > CAD > Fitted line.

-
Select whether the line should be constrained Horizontally or Vertically. No constraint will use the best fit for the line.
The line is saved in the cad container and is coloured the average colour of the selected points.