Legends
The following table describes the tools in the Legends section of the Home tab.
| Tool | Description |
| Drillhole Visualisation | Changes the display of drillholes in the View window. |
| Apply Object Legend | Uses a legend to colour selected objects. |
| Text | Creates or edits a set of text names and the colours to represent the names. |
| Numeric | Creates or edits a set of numeric divisions and the colours to represent the divisions. |
| Integer | Creates or edits an integer legend. |
| Selection | Creates or edits a colour legend based on the current colouring of a data attribute. |
Drillhole Visualisation
The Drillhole Visualisation tool allows you to quickly display drillholes, traces or labels. It encourages you to spend more time looking into your data and identifying trends and correlations. This will help you define your geological domains in the next step.
The Drillhole Visualisation tool can be found in the Modelling, DomainMCF and Stratigraphic ribbons under the Drillholes section.
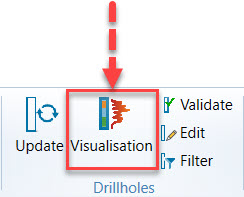
A new panel will open.
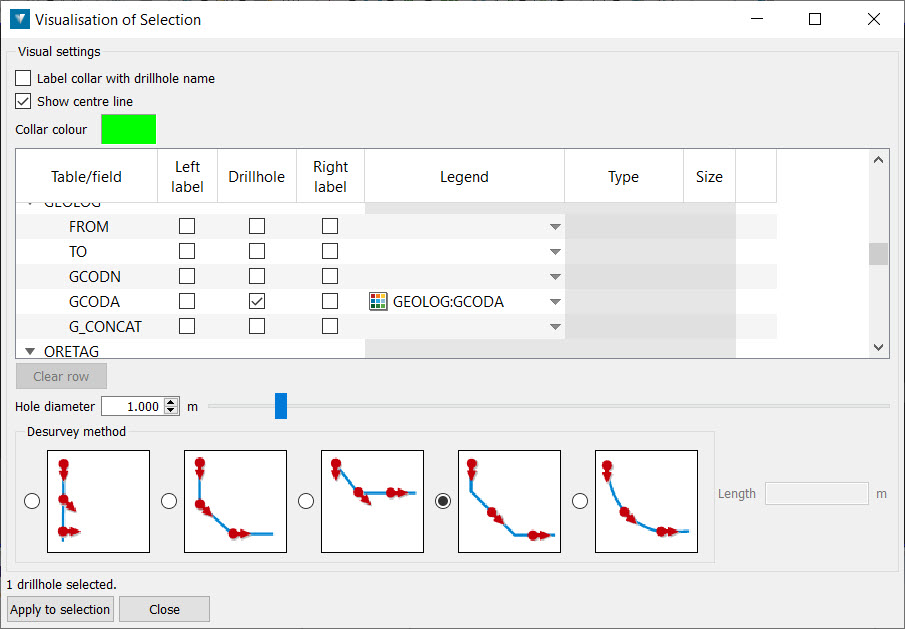
To colour drillholes, provide the following visual settings:
-
Label collar with drillhole name — Check this if you want to label the collar with the drillhole name in the view.
-
Show centre line — Check this if you want to show the centre line.
-
Collar colour — Select the collar colour.
-
Table — Select a table from the imported drillhole database and then a field according to which you want to colour your drillholes. Then, choose to add:
-
A left label
-
A drillhole
-
A right label
-
A legend. This legend is either created or imported.
-
A type from either Flag, Label or Flag and Label. In the image below, the type has been set to Flag and Label.

-
A flag/label size
-
-
Hole diameter — Enter the diameter of the selected drillholes.
-
Desurvey method — Choose a visualisation mode for the selected drillholes. The default and recommended desurvey method is Tangent.
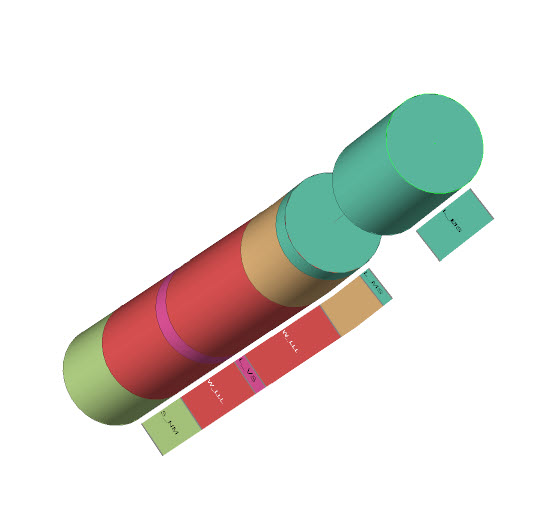
When you are happy with your visual settings, click Apply to selection. View your results in the View.
Apply Object Legend
To colour selected objects using a legend:
-
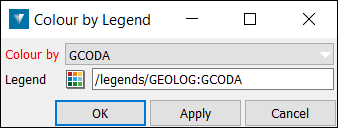
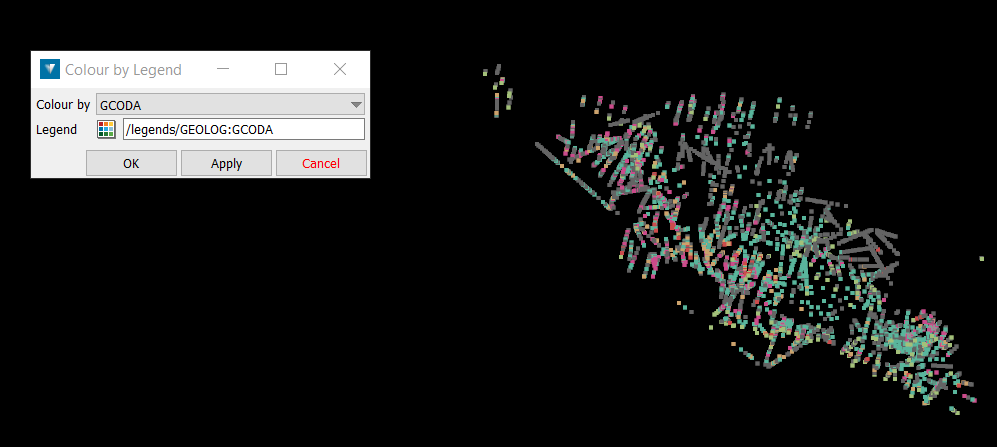
Go to Home > Legends > Apply Object Legend. This will open a new panel.
-
Select an object that can be coloured by a legend such as drillholes or a point set.
-
Set the Legend field, by dragging and dropping a legend from the Data Explorer.
-
Click OK or Apply.
Here is an example of the result you can get from applying a legend to an object:
Text
Text legend is used to create or edit a set of text names and the colours to represent the names. The resulting legend may be used to colour by legend for data such as drillhole horizons.
-
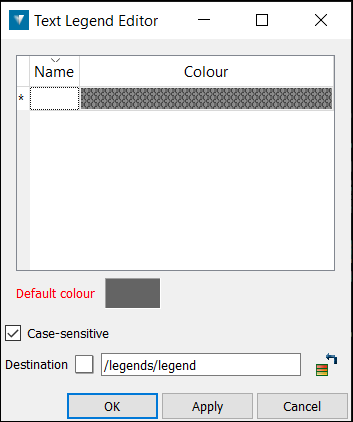
Select Home > Legends > Text editor.
-
Select a name for the Legend in the Save as field. Dragging and dropping a legend into this field updates to the new legend, until the legend is edited.
-
Click in the colour field to select the Default colour that will be applied to any undefined text. Double-click to display the advanced colour panel.
-
Double-click in the first Name field and type the first text name.
-
Double-click in the Colour field and select a colour from the palette.
Note: The same colour may be applied to more than one row.
-
Tab across to create a new row, or click and enter text in the * row.
-
New rows can be inserted or deleted if required by right-clicking in the table. To populate the table, drag and drop an existing text legend or stratigraphy into the Horizon table. Note: Additional legends can be appended.
Note:Legends can be displayed by dragging them into the View window.
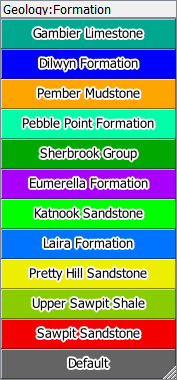
Below is an example of a text legend used to display drillhole intervals by Formation.
Numeric
Numeric legend is used to create or edit a set of numeric divisions and the colours to represent the divisions.
The resulting legend may be used to colour by legend for data such as drillhole assay or quality data (e.g. gold grade, ash %). Numeric legends may also be used to colour by height for surfaces and for various point attributes in geophysical data, such as airborne gravity or magnetics surveys.
-
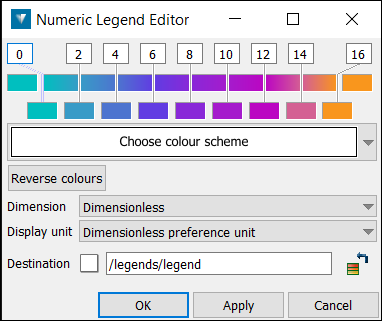
Select Home > Legends > Numeric editor.
-
Select the location to save the legend in the legend field (or drag and drop a legend to be edited into the field if required).
-
Edit the division values as required.
-
Right-click on the horizontal colour bar for more options.
-
To add a new interval, right-click on the required place and select New.
-
To remove an interval, right-click and select Delete, or hover over the division with the cursor and select
 .
. -
Select Spread Evenly to move intervals to be evenly spaced between the minimum and maximum.
-
Right-click on the legend and select Intervals to insert multiple intervals between a defined range.

-
Right-click on the legend and select Colour scheme to select a pre-defined colour scheme, or to specify how the transition between colours should be defined.
-
Smooth — A smooth colour transition between the colours defined at the interval boundaries.
-
Solid — A single colour for each interval.
-
Zebra —Alternates between the first two colours.
-
Reverse — reverses the order of colours in the chosen colour scheme
Colours may be manually defined for each legend division by clicking on the colour square to display the colour palette and select the required colour. Double-click to display the advanced colour panel. Alternatively, the Generate colours button can be used to cycle between a list of predefined colour schemes.
-
The Reverse colours button reverses the order of the colours in the legend.
-
Select units to display in the legend by choosing from the Dimension drop down.
-
Click OK or Apply to complete.
Note: Legends can be displayed by dragging them into the View window.
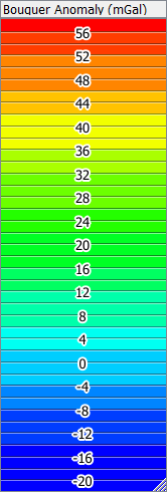
Below is a numeric legend used to colour a gravity data set by its Bouguer Anomaly attribute.
Integer
Integer legend is used to create or edit a set of integer names and the colours to represent the names. Configuring an integer legend is very similar to configuring a text legend.
Selection
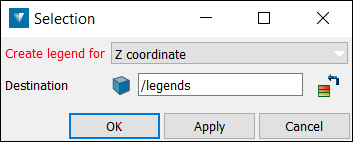
Selection is used to create or edit a colour legend using the attributes of an object.
-
Select Home > Legends > Selection.
-
Select the object to be used to create the legend in the Explorer window.
-
Select the attribute to be used to create the legend from the Create Legend for drop-down list. Note: Only attributes present in the selected object are available in the list. If multiple objects are selected which have different attributes, the attribute lists are appended.
-
Select a location to save the legend.
-
Click OK or Apply to create the legend.
-
Drag and drop the legend onto the object in the View window using the middle-mouse button to associate the legend with the object.