Lithology Targeting
The following table describes the tools in the Lithology Targeting section of the Stratigraphic tab.
| Tool | Description |
| Create Intervals From Downhole Data | Use drillhole or geophysical data to generate drillhole intervals. |
| Set Intervals | Set the value of an interval for a specified field. |
| Label Seam Intervals | Automatically label seams. |
| Survey From Geophysical Log | Use survey information in geophysical logs to update drillhole profiles. |
Create Intervals From Downhole Data
The Create Intervals from Downhole Data option is an interactive tool for defining a single domain based on numeric conditions. Rules can be set on up to 3 numeric fields stored in the database or associated LAS geophysical files. Geophysical logs may be linked to a drillhole with the Associate Geophysical Log option.
To set multiple domains at the same time, use the Domain Manager.
Set
Once drillholes are selected, the Set option will provide a drop down list of all the available text type fields, the one selected will be the one written to. Note: Any existing depth and field information previously existing will be entirely replaced upon acceptance of the OK or Apply buttons. It is often worth creating a new empty table type in the input database to write to if existing data is to be retained.
To
Enter the value to be inserted into the database once the conditions are met. This value will also be shown in the preview window within the panel. This value should be text with no spaces or special characters.
When
This is the first of the conditions to be set, a single condition may be set or up to 3 can be used in conjunction to define the required ‘target’ intervals. The drop down list on all of these panels will show all numeric values in all the tables in the input drillhole database in addition to any fields in associated downhole geophysics LAS files.
And:
Optional second and third traces to be used in conjunction with the first.
Change
Each of the traces selected can be individually interrogated for the desired values representing the lithology required.
Select from the top drop-down whether the value required is Below or Above the threshold defined. Note – the results of this and any other selection on this panel can be dynamically seen in the preview panel by choosing the ‘Apply’ button.
Adaptive Threshold — In this mode, each individual Drillhole or LAS trace is checked and then a ‘normalised’ value is displayed at the threshold value selected via slider bar or direct input. This mode is useful when there is no guarantee that a fixed trace range can be compared between all input Drillholes in the selection.
Fixed Threshold — In this mode, the value entered will be directly compared against the trace values for all holes selected, irrespective of whether this value actually falls within the range of the trace. HINT — look at the statistics for the trace shown at the bottom of the sub-panel for a guide to the range of values found.
This type of selection is ideal for traces which have already been processed by the geophysical contractor, typically things like density traces or calipers.
As previously, use the Apply button on the sub-panel to check the results prior to final commitment to the database.
Ignore measurement values
The values optionally included here allow a specified distance to be ignored at the top and/or the base of the drillholes selected. This can be useful to avoid areas of Drillhole casing or water level inclusion which may return ‘false positive’ results to your lithological selection. HINT - To see the entered values take effect in the preview window – simply click in another entry on the panel.
Minimum interval thickness
Enter a value to be used for all the holes selected in this panel – any targeted lithology ‘picks’ which are thinner than this thickness threshold will not be shown in the preview window and hence ultimately not saved back to the Drillhole database. This is ideal for removing ‘noise’ or thin intervals which are of no economic importance, but should be used with caution in situations of seam splitting as smaller split intervals may be inadvertently ignored.
Note: after finalising the general panel parameters, it is recommended that a selection of representative drillholes and their subsequent targeted lithology outcomes be previewed via the ‘Display drillhole’ drop-down list.
Select OK to enter the parameters and close the panel, Apply to enter the parameters and keep the panel open or Cancel to close the panel with no save to database. Note: Panel entries will be lost, so it is recommended that settings be screen-captured for future reference.
Note: Depending on the size and type of Drillhole database being updated, this operation may take a few minutes – allow some time for it to complete the operation.
After saving, any drillholes displayed in the main graphics window by the relevant field will dynamically update.
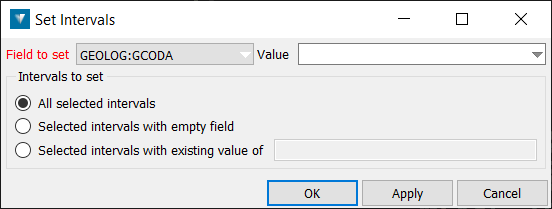
Set Intervals
The field value of a specific interval can be set or updated here.
-
Select Stratigraphy > Lithology Targeting > Set Intervals from the menu.
-
Choose the field of the drilling database to be amended, using the drop-down menu, and enter the new value in the Value field.
-
Select the appropriate radio button for the intervals the new Value is to be entered into.
-
Click Ok or Apply to carry out the field substitution in the drilling database.
Label Seam Intervals
This option can be accessed directly via the option Drillhole > Create intervals or will be presented after use of the option Create intervals from downhole data, to enable labeling of logging intervals.
Note: This option does NOT have to be run on all the loaded drillholes — a sub-selection of drillholes or even units within drillholes can be used as input to ‘build up’ the correlation and subsequent labelling in several passes.
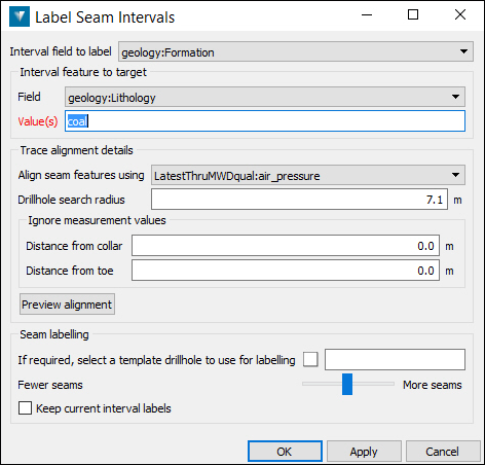
Interval field to Label:
This is the field in the drillhole database (usually a ‘formation’ or ‘horizon’ field) you wish to write the predicted horizon names to. This is not the same field populated by the Create intervals from downhole data option.
The resultant labels will initially be in simple alphabetic order, ‘A’, ‘B’, ‘C’ etc – or labelled as not correlatable – this can be changed later in the process.
Interval field to target:
-
Field — This is the field populated by the ‘Create intervals from downhole data’ option which has the existing lithological value that defines the existence of correlatable horizon(s)
-
Value(s) — Enter the value previously populated by the ‘Create intervals from downhole data’ option or similar – this value will be used to select the trace intervals used in the horizon labelling. (“Coal” in the example image above)
Trace alignment details
Align seam features using — Select the numeric trace (from Database or associated LAS file) which best highlights the horizons to be labelled. Typically this was also used in populating the initial ‘target’ field values.
Drillhole search radius —This distance will be automatically calculated when the drillholes are selected and can be edited – adjacent drillholes within this radius will be considered in the correlation calculations – care should be taken not to include drillholes so distant that their horizon ‘signature’ does not correlate with the drillhole being evaluated.
Ignore measurement values:
-
Distance from collar — Selected trace values equal to or less than this distance from the collar of the drillhole will not be considered in correlation calculations – typically, this would be used to exclude false readings due to weathering zones or casing.
-
Distance from toe — As above, but the distance is taken from the toe of the hole, in this case false readings may be the result of hole collapse or other damage.
Preview alignment
The selected drillholes on the screen will be temporarily shifted in the vertical direction to preview the proposed alignment of intervals to be correlated prior to any actual labels being written to the database. A good tip is to have the drillholes visible in an oblique view with traces or lithological intervals highlighted so the predicted correlation is easy to check. If the alignment is not acceptable, changing the search radius or trace may improve results. This preview does not affect the drillhole location in the database.
Seam labelling
This option allows the use of a previously correlated drillhole (containing the final horizon names used at site) as a template for replacing the automatically generated correlation labels for more realistic names.
If required, select a template drillhole to use for labelling — Drag the selected ‘template’ drillhole from the graphics screen or Eureka explorer (or type in the required name) into the panel to populate.
Fewer seams/More seams — Move the slider bar towards the required output to ‘group’ (Fewer seams) or ‘split’ (More seams) the resultant number of suggested correlatable horizons. TIP! By sliding the bar and then using the ‘Apply’ button – the preferred number of output horizons can be shown and adjusted prior to final acceptance.
Keep current interval labels — Select this option to keep any previously correlated values in the ‘Interval field’ from being overwritten by subsequent correlation labelling runs.
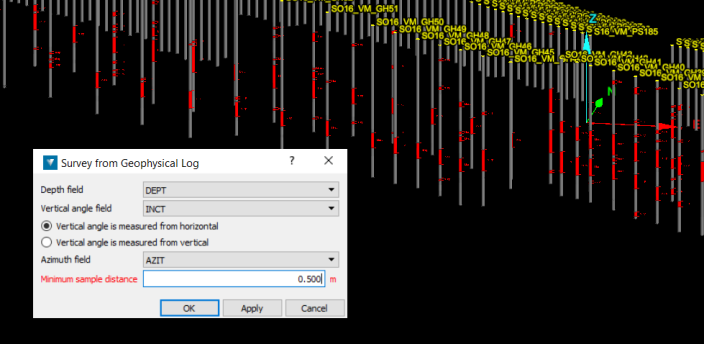
Survey From Geophysical Log
This option allows detailed downhole survey (DSR) information, often available in LAS downhole geophysics files, to be applied to existing Drillholes to more accurately locate then in 3D space. The option also allows resampling of the LAS information to larger depth intervals to reduce overall database size whilst not losing location accuracy.
Note: for LAS files are to be used – these need to be associated with the boreholes of interest prior to the use of this option. Drillholes to be used also need to be pre-selected on the screen or via the Explorer.
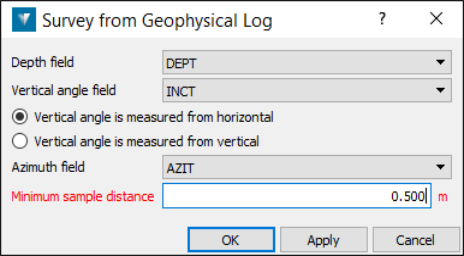
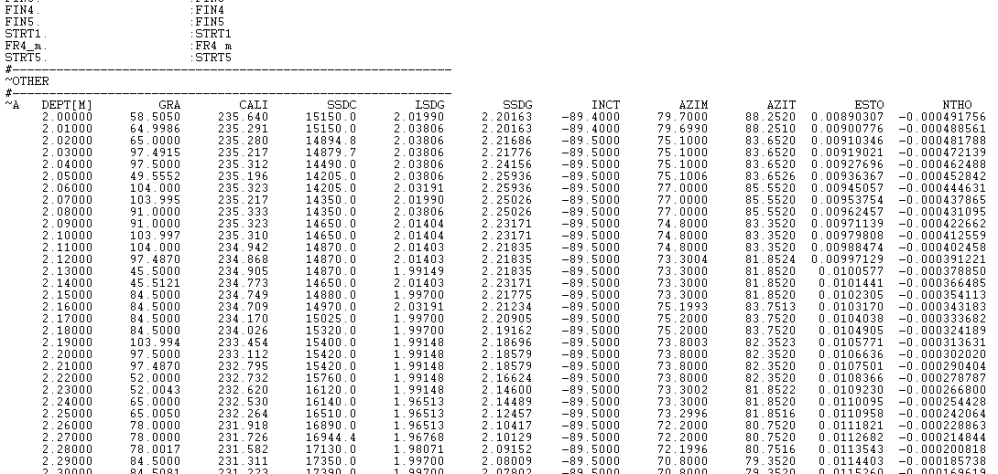
Image of typical LAS file containing DSR information in the ‘DEPT’, ‘INCT’ and ‘AZIT’ fields (in this example) NOTE – the original input sampling interval is 0.01 metre, which results in 10,000 records per 100 metres of Drillhole depth.
Depth Field
From the drop down list, select the field from the LAS files which represents the downhole depth measurements.
Vertical angle field
From the drop down list, select the field from the LAS files which represents the angle (dip) measurements, these are typically recorded according to two conventions, from the horizontal (i.e. -90 is vertical) or from the vertical (i.e. 0 is vertical) the input LAS data should be checked to understand which is appropriate for the Drillholes selected.
Hint: load the holes into the graphical screen to see the results of panel settings – use the ‘Apply’ button to preview.
Select the appropriate setting via the radio button:
-
Vertical angle is measured from horizontal
-
Vertical angle is measured from vertical
Azimuth field
From the drop down list, select the field from the LAS files which represents the downhole azimuth (bearing) measurements. These are by convention measured in degrees relative to North (0 degrees) in a clockwise direction.
Minimum sample distance
Optionally select a resampling distance (typically 0.2 to a few metres – depending on Drillhole depth) to reduce unnecessary data density on DSR and ultimately database size and performance.
Drillholes prior to DSR inclusion
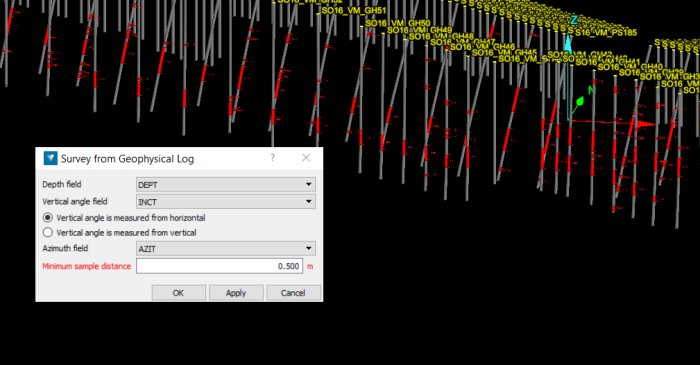
Drillholes after DRS resampling and application.
Select OK to enter the parameters and close the panel, Apply to enter the parameters and keep the panel open or Cancel to close the panel with no save to database. Note: Panel entries will be lost, so it is recommended that settings be screen-captured for future reference.
Note:Depending on the size and type of Drillhole database being updated, this operation may take a few minutes. Allow some time for it to complete the operation.
After saving, any drillholes displayed in the main graphics window by the relevant field will dynamically update.