Colouring
The ![]() Colouring tool allows you to colour the surface using various methods.
Colouring tool allows you to colour the surface using various methods.
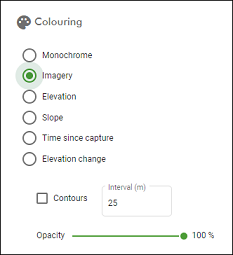
Colouring options
In the ![]() Colouring tool on the
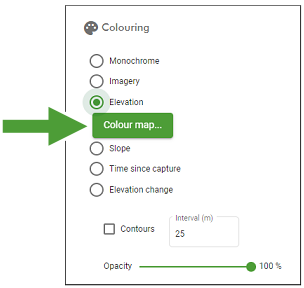
Colouring tool on the ![]() Home page, select the desired colouring method and configure as explained below.
Home page, select the desired colouring method and configure as explained below.
Monochrome
Monochrome colouring applies a single colour uniformly to the surface.
|
|
A surface coloured monochrome |
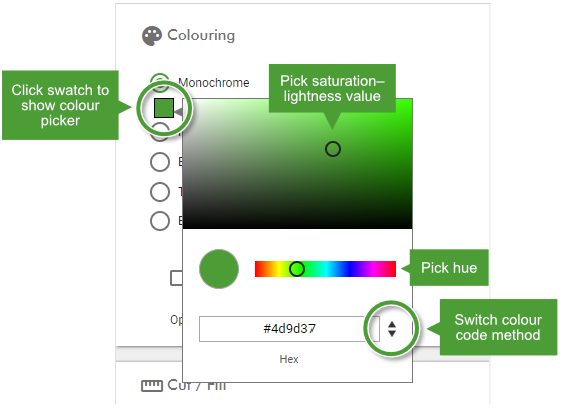
To change the uniform colour, click on the colour swatch below the Monochrome radio button to show the colour picker.
-
Adjust the colour as desired using the hue slider or saturation–lightness picker.
Alternatively, you can specify a colour by hexadecimal (hex), RGB (red–green–blue), or HSL (hue–saturation–lightness) code using the field at the bottom. Click the spinner arrows to the right of the field to cycle through the colour code methods.
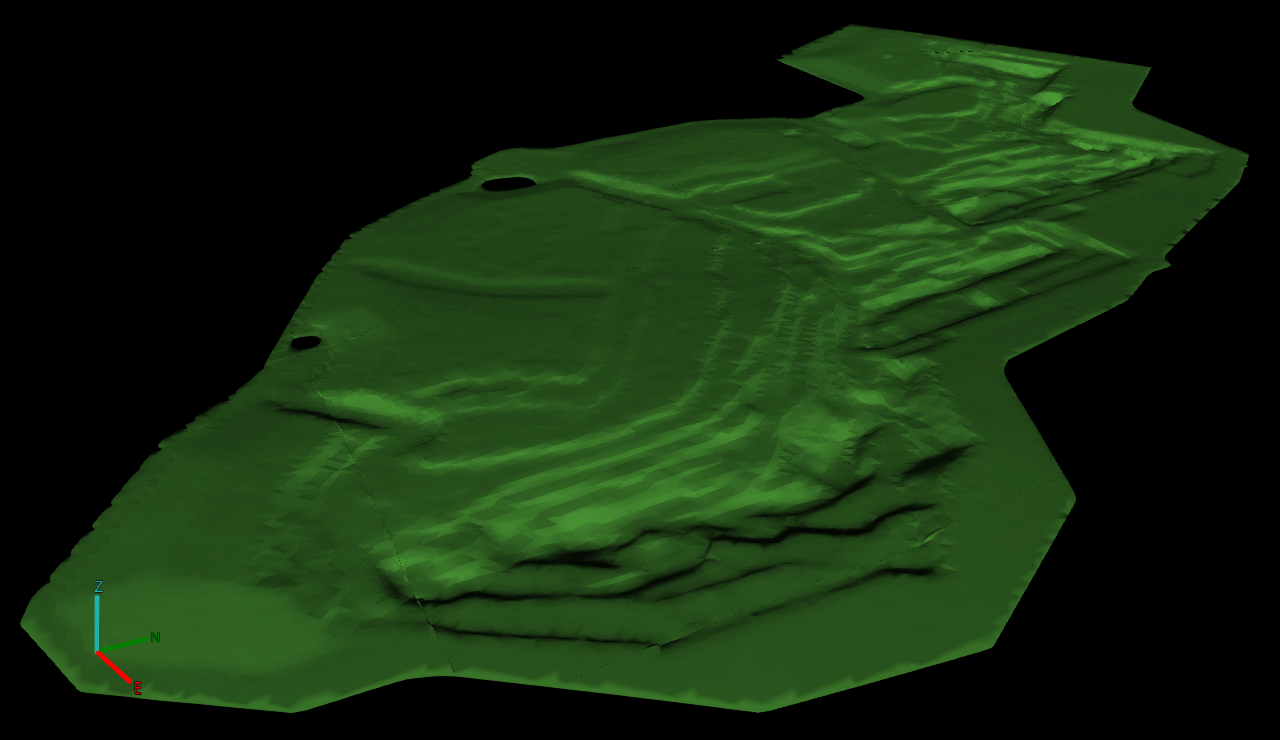
Imagery
The Imagery colouring option colours the combined model by satellite imagery obtained from Bing Maps.
-
An internet connection is required to display satellite imagery. The viewer must also not be in offline mode; toggle the
 button located in the top-right corner of the viewer to switch between online and offline mode.
 -
Depending on the location, satellite imagery might not be frequently updated.
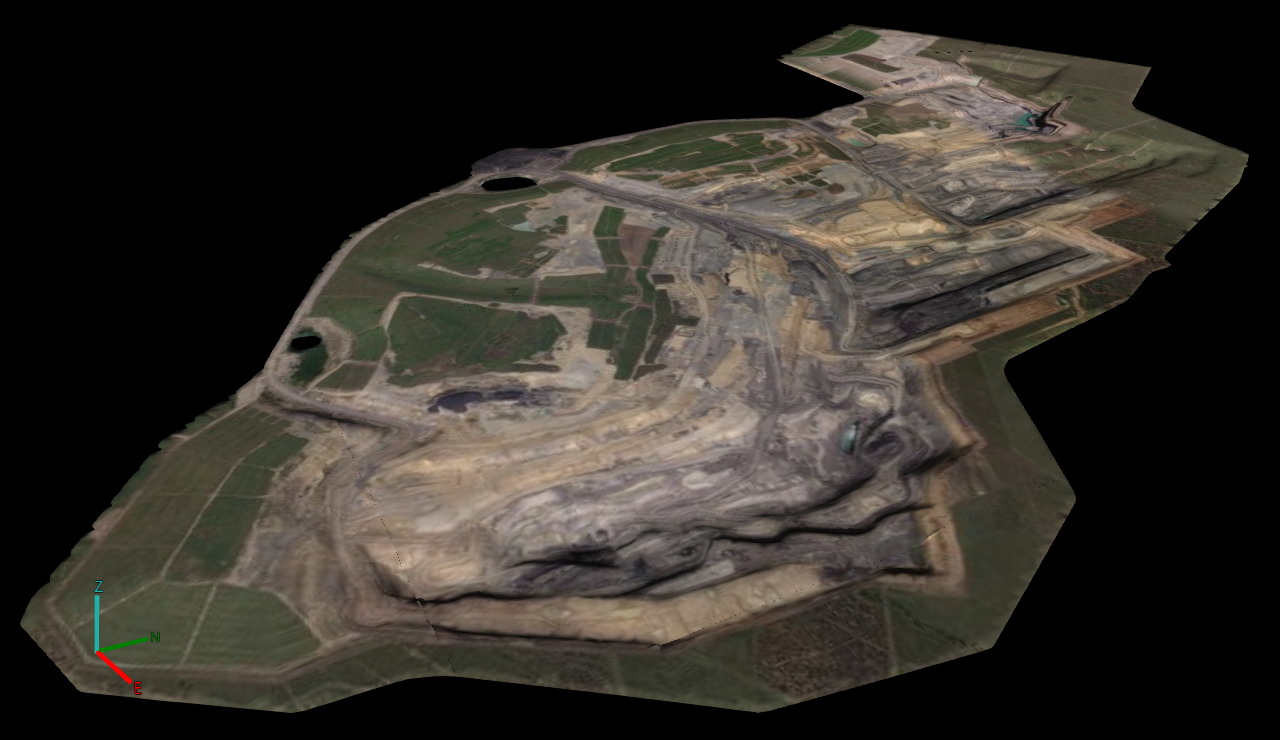
|
|
A surface coloured with satellite imagery |
Elevation
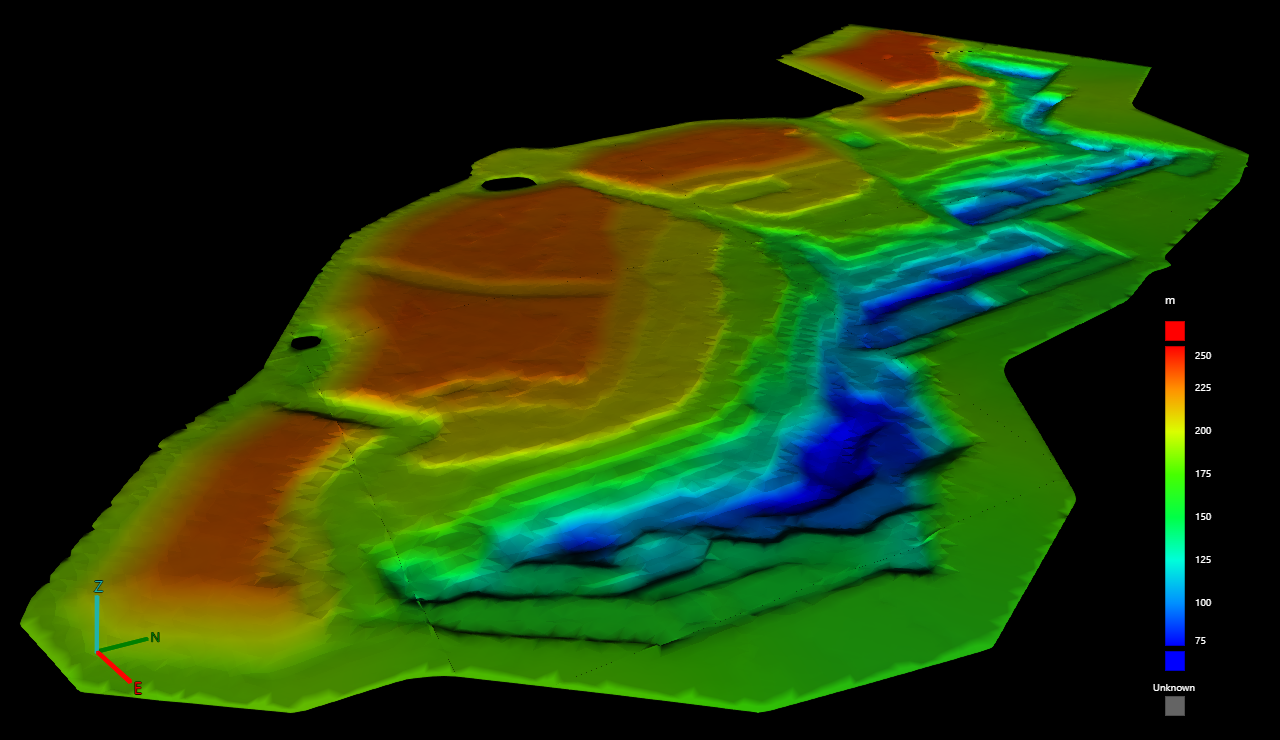
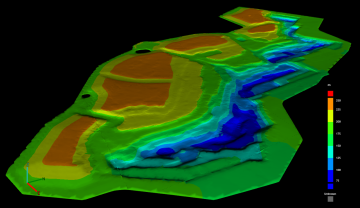
The Elevation colouring option colours each part of the surface by elevation according to a configurable colour map.
|
|
A surface coloured by elevation |
See Configuring colour maps on this page for details on configuring the elevation colour map.
Slope
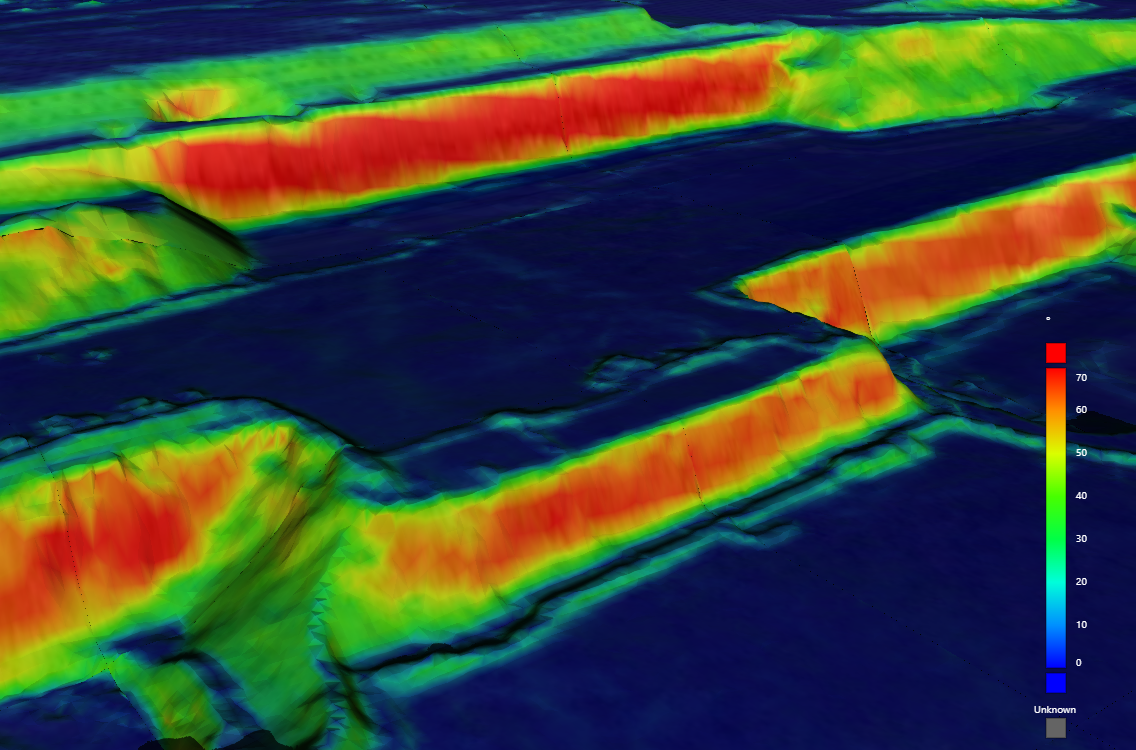
The Slope colouring option colours the surface by slope angle according to a configurable colour map.
|
|
Detail of a surface coloured by slope |
See Configuring colour maps on this page for details on configuring the slope colour map.
Time since capture
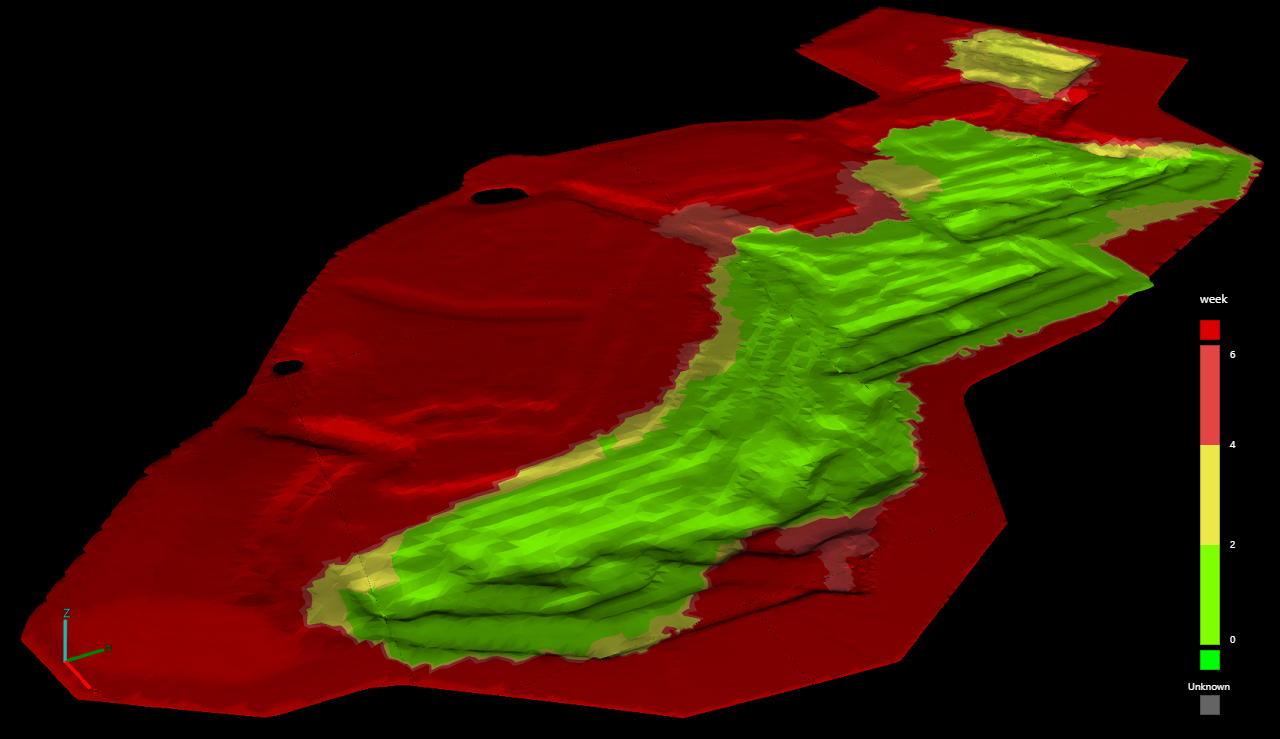
The Time since capture colouring option colours the surface by the age of the most recent source surface contributing to each part of the combined surface according to a configurable colour map. This is particularly useful to quickly identify which parts of the surface have not been updated recently and may require resurveying.
|
|
A surface coloured by time since capture. From the legend, we can see that most of the surrounding combined model and parts of the pit in red have not been updated for 4-6 weeks or longer, indicating they might need to be resurveyed. The main pit area in green has been recently updated. |
See Configuring colour maps on this page for details on configuring the colour map.
Elevation change
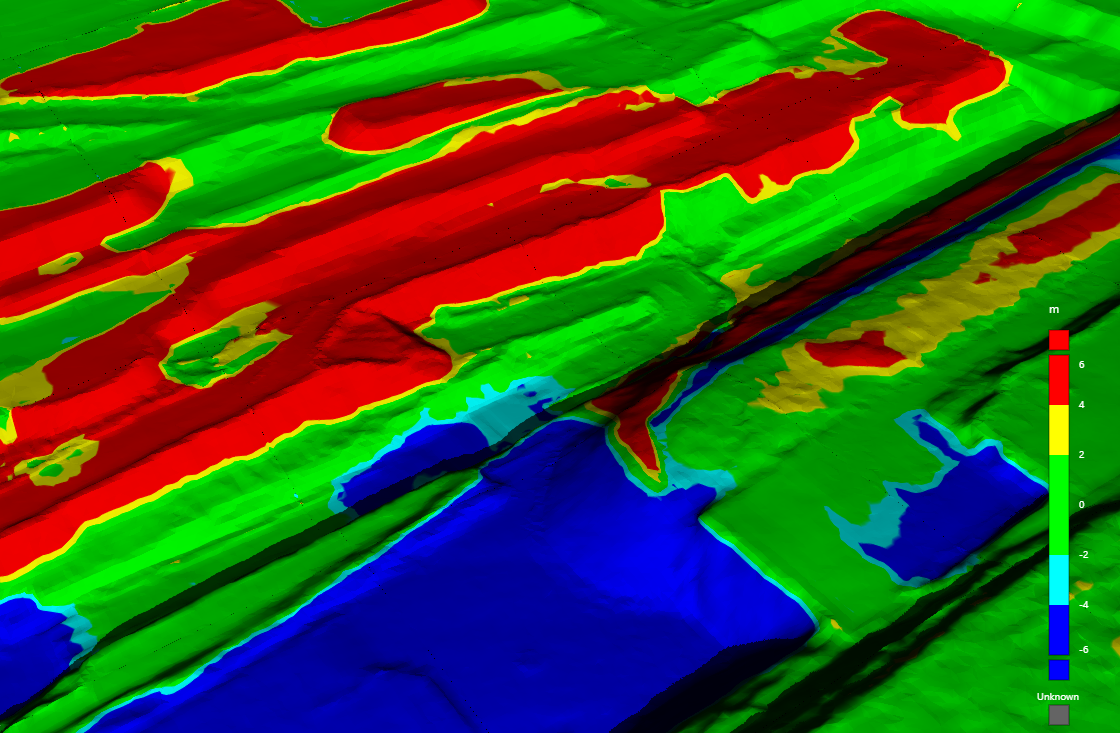
The Elevation change colouring option colours the surface by the change in elevation over a given time period according to a configurable colour map. This colouring option is useful to quickly visualise which parts of an operation have been subject to the most activity.
|
|
A surface coloured by elevation change. In this example, parts of the surface coloured yellow or red have been raised in elevation by 2 metres or more since the start of the period. Parts of the surface coloured cyan or blue have been lowered in elevation by 2 metres or more. |
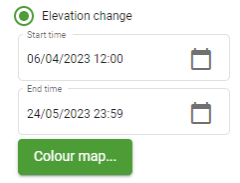
- Configure the Start time and End time fields to define the period of time over which to calculate the elevation change.
-
Click Colour map... to configure the colour map to colour the surface by. See Configuring colour maps on this page for details on configuring the elevation change colour map.
Contours
Select the Contours checkbox to apply contour lines to the surface at the given intervals.

|
|
A surface coloured by elevation with contours applied |
Opacity
The Opacity slider allows you to make the current colouring method translucent, revealing the underlying satellite imagery.
Configuring colour maps
To configure the colour map for colouring methods that use one, follow these steps.
-
Click the Colour map... button under the colouring option.
The Customise Colour Map panel appears.
-
Choose a colour map to start with. You can either customise the colour map as it is currently defined, or load a preset or saved colour map, which you can then further customise.
-
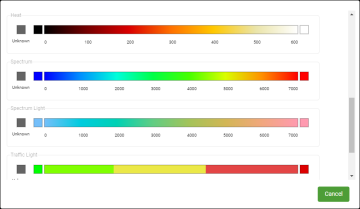
To load a preset colour map, click From Preset and then select a preset colour map from the list.
-
To load a previously saved colour map, click From Library and then select a saved colour map from the list.
-
-
Configure the colour map as follows.
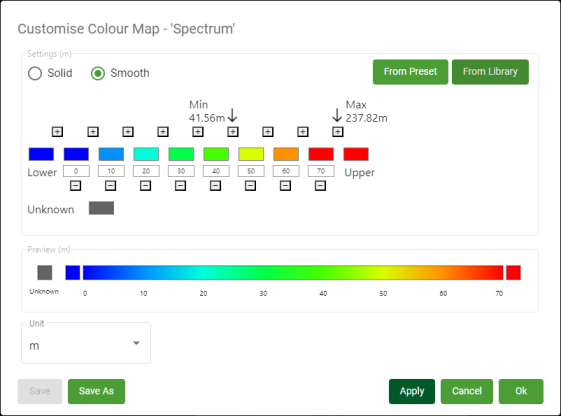
Solid / Smooth Select from the following colour map interval types:
-
Solid: Use discrete intervals, each coloured with a solid colour.
-
Smooth: Use continuous intervals, interpolating the colours between each defined interval.

Select unit From the Unit drop-down, select the unit for the colour map. This unit will be displayed on the legend in the view.
Tip: Select the unit before setting the interval boundaries, as changing the unit will convert the values from the current unit to the new unit.
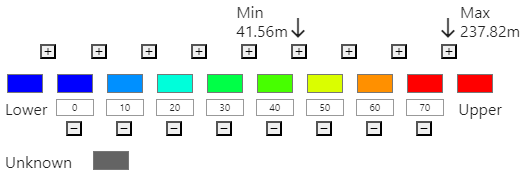
Interval picker Configure the colour map intervals using the interval picker. The range of values for intervals should be appropriate to the type of data to be coloured and the expected data value range. The Elevation colour map tool displays the minimum and maximum elevations of the surface (see Min and Max in the image below).
-
To define an interval boundary value, click in its numeric field and enter the boundary value.
Interval boundaries must maintain ascending order from left to right. If you change the value of a boundary to be less than its left neighbour, or greater than its right neighbour, the boundaries will automatically be reordered.
-
To define the colour for an interval (solid colouring) or at an interval boundary (smooth colouring), click on the colour swatch to show the colour picker and choose a colour.
-
To insert a new interval boundary, click the
 button between two existing intervals.
 -
To remove an interval boundary, click its
 button.
The Lower and Upper colours define how to colour data below and above the lower and upper interval boundary values, respectively.
The Unknown colour will be used to colour any data with an unknown value.
Preview This displays a preview of what the resulting legend will look like. -
-
Optionally save the current settings.
-
If the current colour map was loaded from a colour map saved to the library, click Save to overwrite the saved colour map.
-
To save the colour map to the library under a new name, click Save As and then enter a new name for the colour map.
-
-
Click OK or Apply.
