Material Movements
Source file: material-movements.htm
Material Movements visualises and catalogues how materials move over time. There are two ways in which material movements are displayed, as follows:
-
Material Movements - Timeline: Use the timeline to play an animation of stockpiles as they are added or removed. The timeline uses a full-screen terrain viewer and playback-style controls for running the animation.
-
Material Movements - Stockpile: Generate a table based on the trips occurring at a particular stockpile or zone in a given period of time. You can also filter your data, view the properties of particular stockpile via tooltips in the Properties column, and view single or multiple trip paths in the viewer.
Using the Timeline page
Material Movements -Timeline view visualises all (site-wide) material movements over a period of time. Activity is shown in real time or at different playback speeds. To use this viewer, follow these steps:
-
Manipulate the view to observe the area of interest.
-
Set the Time period field using any of the following methods:
- Open the Time drop-down and select a preset period or shift from the list.
- Use the
 and
and  buttons to jump to a previous or next time period.
 - Click
 to open the calendar picker. Select a start and end date, and a start and end time. Click
  to save and close the calendar picker.
-
Click
 to initiate the query. During this time a blue progress indicator advances along the top of the viewer. Loading time can vary, depending on the amount of data.
 -
Use the playback controls to run through the animation sequence. To learn more, see Using the playback controls.
Tip: Click the
 button to recentre the currently loaded view.
 Tip: Click the
 button to re-orient the view if it has been tilted or rotated.
Using the playback controls
The playback controls, located along the bottom of the page allows you to run the animation of material movements. Use the playback transport controls to play through the time sequence.
-
To start playback in ascending time, click
 , or in reverse time, click
  . Note: The playback loops continuously in the forwards direction only.
 -
To stop playback click on the
 (pause) button. To resume playback, simply click
  again.
 Note: When enabled, the pause button has a green border.
-
To change the playback speed, drag the speed-control dial towards the left or the right of the centre position in the dial. Playback can be magnified up to 604800x (real-time playback speed ), in either direction.
Note: If you change the playback direction, the playback speed is retained, but in the opposite scale.
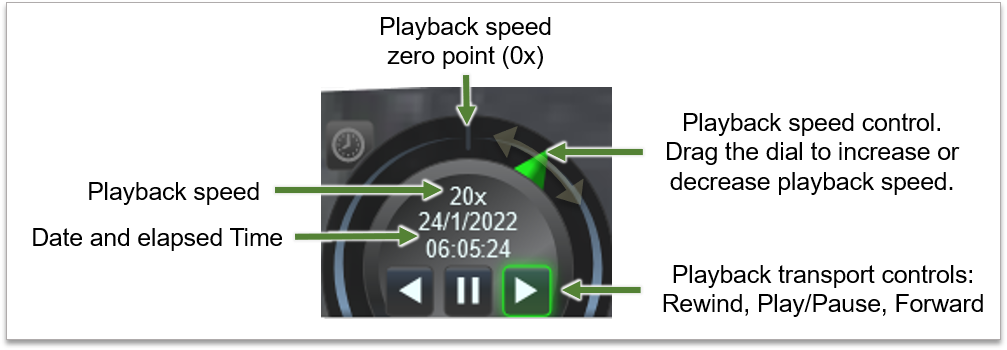
The transport controls allow for playback in forwards and reverse directions. Moving the playback speed control either side of the playback speed zero point increases the playback rate up to 604800x faster than real-time speed.
Use the time bar next to the playback transport controls to cue to a certain position in time You can either click on a point along the time bar or drag the blue scrubber to cue to your desired position You can also drag the scrubber control to animate the time sequence manually.

Timeline viewer configuration
You can configure the viewer to show or hide certain features. To learn more, see Configuring the viewer in Getting Started > Configuring the viewer.
Using the Stockpile page
The Material Movements-Stockpile page uses a table listing trips and related information for a selected stockpile and period of time. This differs from the timeline approach which considers site-wide material movements. This page also provides the following:
-
An optional viewer is available to provide a visual point-to-point representation of material movement.
-
A simple timeline that allows you to queue to specific events or filter a period of time along the timeline.
-
Search for specific trips by using the Load Trip tool or use Search Trips to perform a keyword search.
Generating stockpile reports
-
Select your time range by doing any of the following:
- Open the Time drop-down and select a preset period or shift from the list.
- Use the
 and
and  buttons to jump to a previous or next time period.
 - Click
 to open the calendar picker. Select a start and end date, and a start and end time. Click
  to save and close the calendar picker.
-
Expand the Stockpile drop-down and select the required zone category (stockpile, pit, etc).
-
Use the timeline above the list pane to optionally filter the time range. Simply drag the green blocks to set the start and end time, or click on the timeline itself to move the block nearest to your mouse to that location. Trips are indicated by the small pegs on the timeline. Items outside of your selection are filtered out.

-
Apply filtering options as follows:
-
Load Trip: Enter the Trip id number into the Load Trip field then click on the arrow to update the list pane. The row matching the Trip id is shown.

- Filter the columns in the list as required. The list pane table is configurable, you can control which columns are displayed using
 drop-down located near the top-right of this page. The available columns are as follows:
 - General Properties
Time: The time and date of the trip.
Journal: This is a description of the transaction.
Payload: The tonnage of the material for that trip.
Trip id: The unique identifier used by the FMS.
Digger: The name of the equipment handling the material at the source.
Truck: Then name of the truck moving the material to the destination.
Source/Destination: These are identifiers used by the FMS corresponding to a location. In this case, the source and destination of the trip.
Properties: These are the quantities of different properties associated with that trip. Each property category is separated by a “/” and follow this order:
Numeric/Text/Time/List.
Example: A trip with the following properties: 14/4/1/1 indicates there are 14 numeric properties, 4 text properties, and 1 time and list property in that trip.
Tip: To view the quick statistics panel showing each property and its value by category, simply hover over an item in the Properties column.
Source Name: The location from where the material was sourced.
Destination Name: The location from where the material was deposited.
Properties
Select available properties that you want to include in your query. An additional column is added for each property you select.
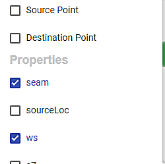
- General Properties
-
Export to Excel
You can export your data as a Microsoft Excel spreadsheet (XLSX) file. MaterialMRT creates a file called ExcelSheet.xlsx. If previous reports were created (from this, or any other MaterialMRT page), a suffix with an increment number is appended to the file name. For example, a fourth report would be named ExcelSheet(3).xlsx.
To export your data, do the following:
-
Configure your search or filtering settings, including which columns to include for your report.
-
Click on the export to Excel button (
 ) at the top-right of the page. The file is immediately generated and saved to your default file download location.
Using the viewer
The viewer shows the passage of material movements from its source location to its destination. A geographical perspective is provided using the viewer. To show the viewer enable the  toggle at the top-right of the page. To hide the viewer, toggle
  to its off position.
Resizing the viewer
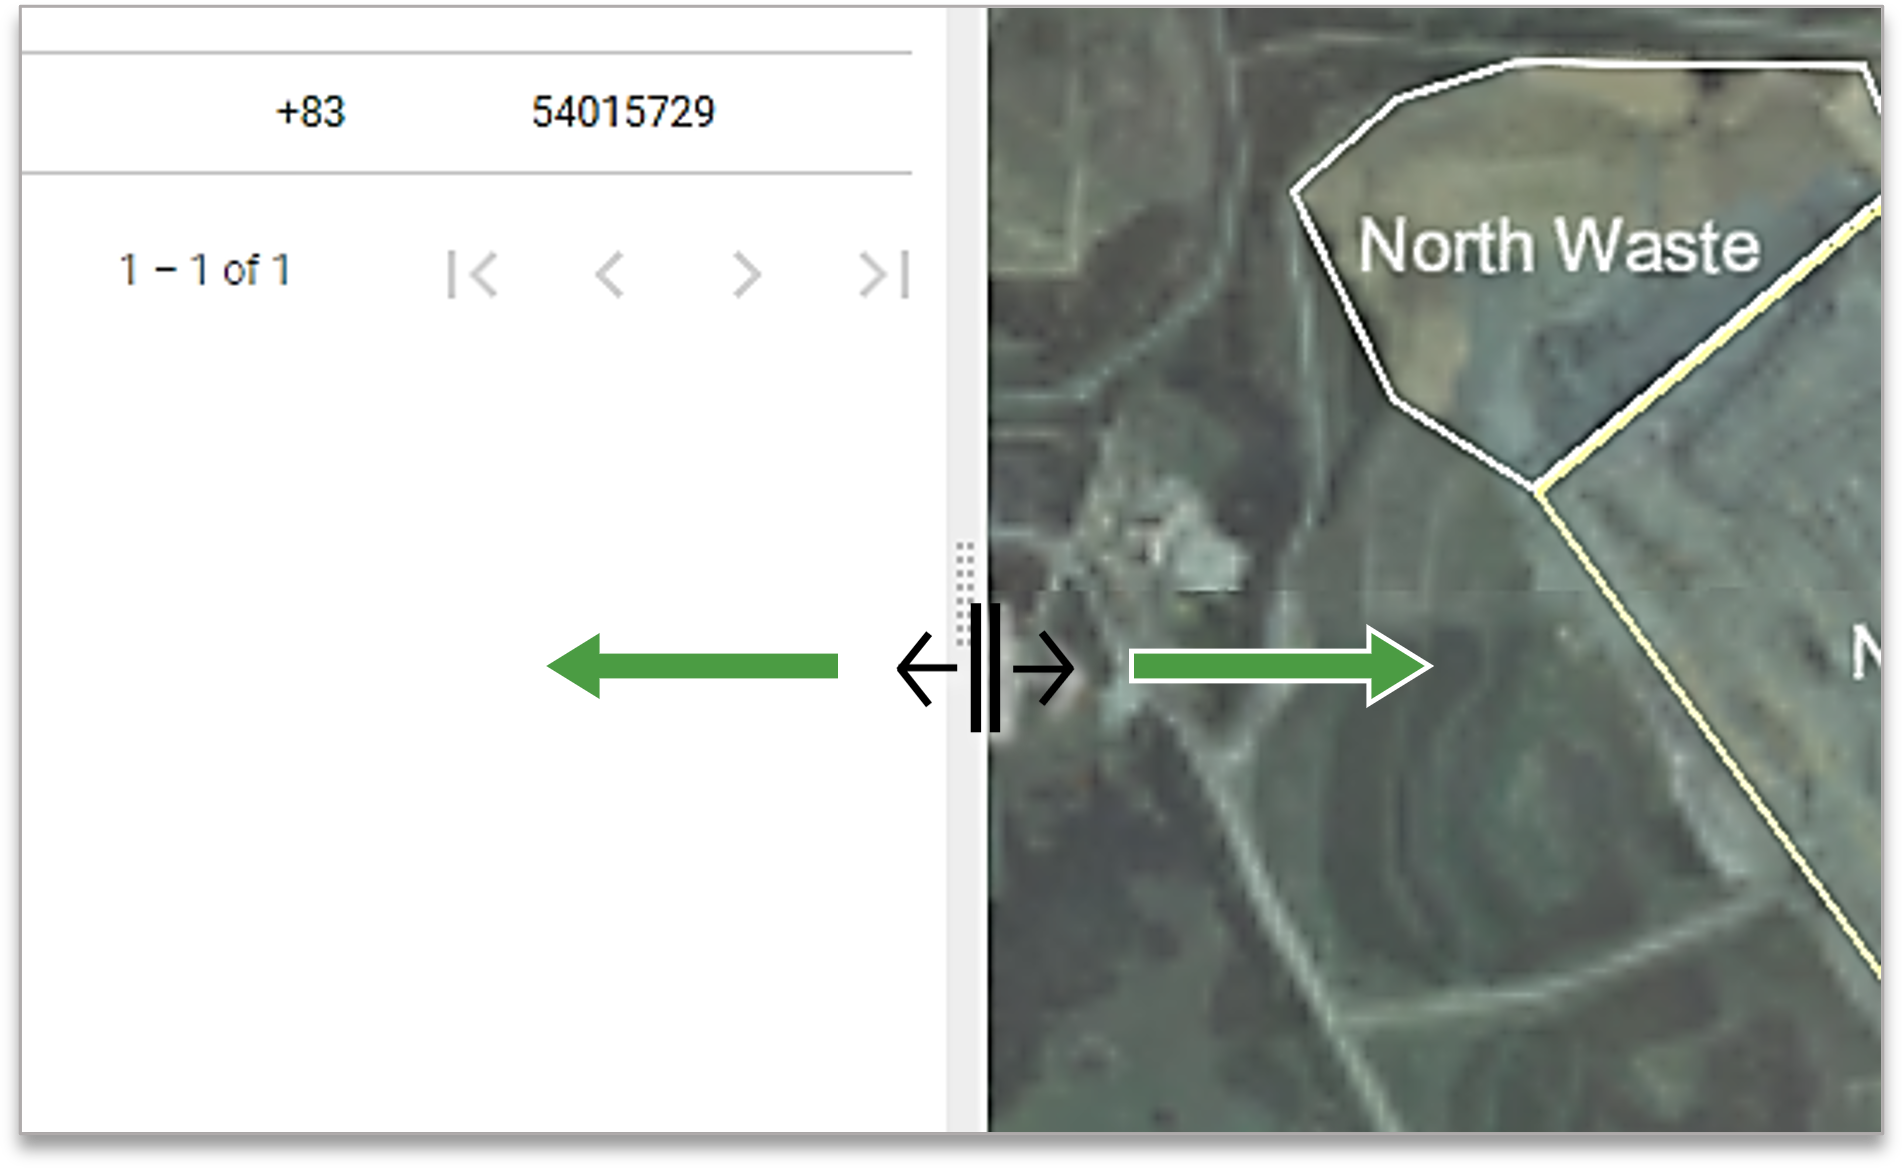
To resize the viewer pane, use your mouse to drag the handle on the partition to the left or the right to increase or decrease the viewer size respectively.
In-viewer controls
In-viewer controls are summarised below:
-
Viewer Mode: Expand this drop-down and select either Single Trip or Multi-Trip mode.
-
Colouring by: Expand this drop-down and select a text property. A legend is displayed at the bottom-right of the viewer.
-
Re-centre camera orientation (
 ): Reset the camera angle and zoom level to the centre of your terrain.
 -
Viewer settings (
 ): Manage terrain imagery. To learn more, see Configuring the viewer in Getting Started.
Viewing movements
Follow these instruction to visualise movements:
-
Follow the steps described in Generating a stockpile report.
-
Click
 to re-orient the view to the stockpile.
 -
Select the Viewer Mode from its drop-down located at the top left-hand side of the viewer. There are two options available:
- Single Trip. When Single trip is chosen, a solid line indicating the trip is shown when the mouse is over a particular trip in the list pane. A label is also shown, revealing the tonnage for that trip.
-
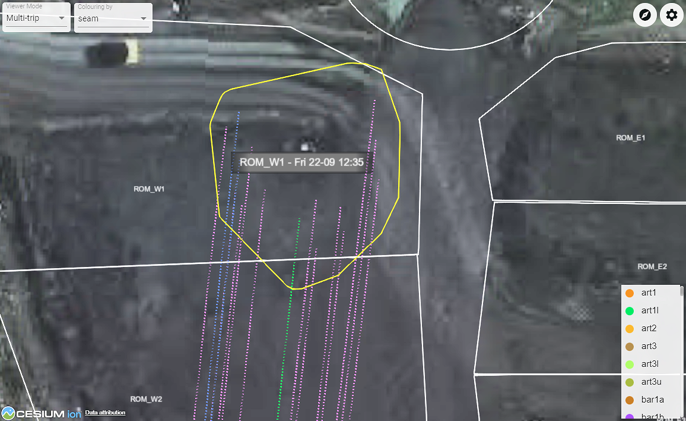
Multi-Trip. When Multi-Trip is selected, all trips to and from the stockpile are shown simultaneously. Each trip is represented by a separate dotted lines.
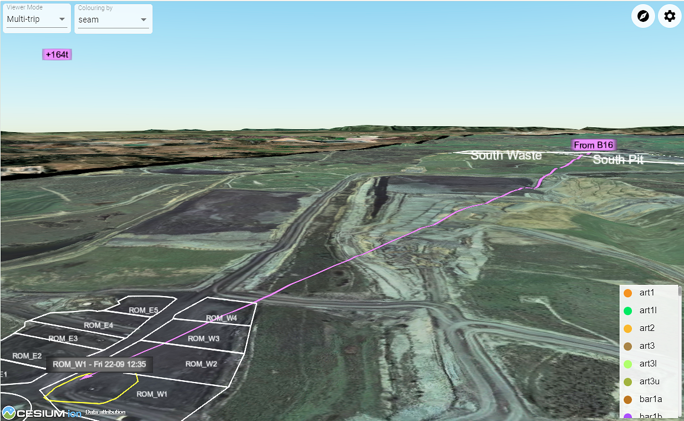
- Select a check box to view a specific trip. The line connecting source and destination becomes solid, and its tonnage label is displayed.
- Select multiple check boxes to show only those trips. The lines connecting sources to destinations revert to being dotted.
-
Select the Colouring by scheme from its drop-down list which is adjacent to the Viewer Mode drop-down. The colour of the lines are based on the chosen schema.
-
Manipulate the view as required to best accommodate the area of interest.
|
Top-down view of the stockpile in multi-trip using the seam schema (note the colour legend) |
|
Multi-trip view with one trip selected. The view has been zoomed out and rotated so that the stockpile and the source location are visible. The payload tonnage is also shown near the top-left of screen. |
