 Measurements
Source file: measurements.htm
The Measurements menu consists of four tools for managing terrain and stockpile models as well as analysing and editing property grade data from the lab or analyser, as follows:
|
Terrain Management |
Manage and import terrain surfaces as up-to-date models become available. To learn more, see Terrain Maintenance. |
|
Stockpile Surfaces |
Manage and import stockpile surfaces as up-to-date models become available. To learn more, see Stockpile Surfaces. |
|
Lab Results |
Examine and modify lab results from a selected shift based on any material property of interest. To learn more, see Lab and Analyser Results. |
|
Analyser Results |
Examine and modify analyser results from a selected shift based on any material property of interest. To learn more, see Lab and Analyser Results. |
Terrain Maintenance
The Measurements - Terrain Surface Maintenance page allows you to manage and import models called terrain scans. Terrain scans are contour models derived from scans and other geospatial data sources. This page is arranged into a tabbed panel and viewer. The viewer will display the selected model for the user's reference. The roles of the Manage and Import tabs are as follows:
|
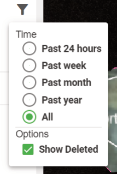
Lists the current stockpile scans and displays them in the viewer. You can also configure which items to include in the list.
|
|
|
Add terrain surfaces as new, or as a replacement terrain model. To import terrain surfaces, follow these steps:
|
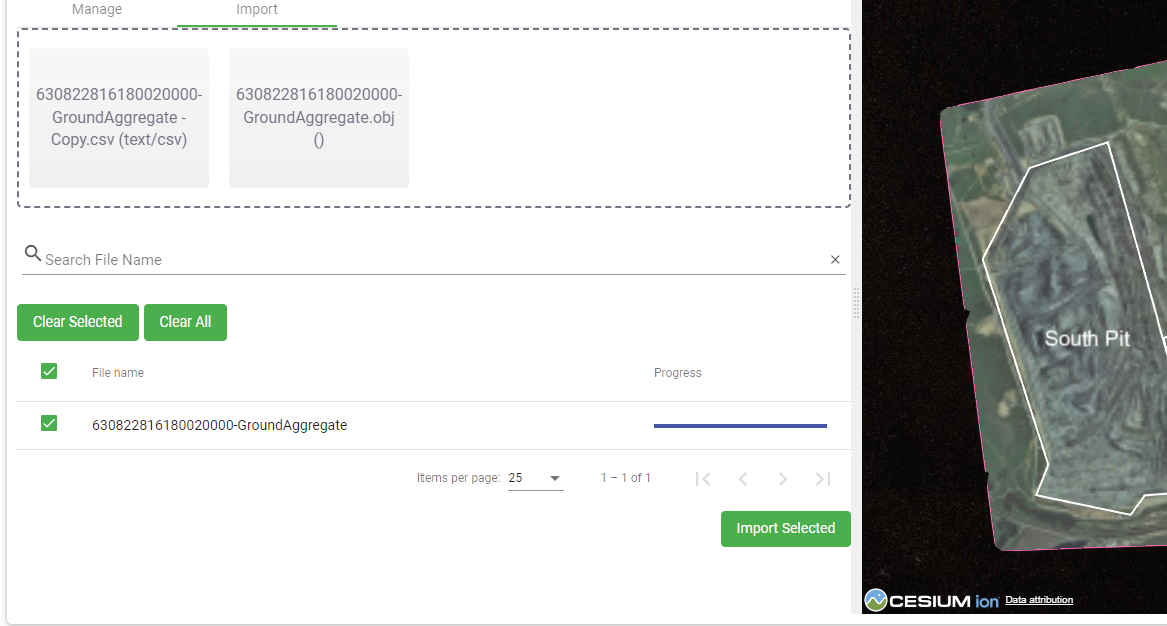
 button. This is the same as deleting a tile in the drop-zone.
 button. This removes all items from the drop-zone.
 to complete the import.
 Stockpile Surfaces
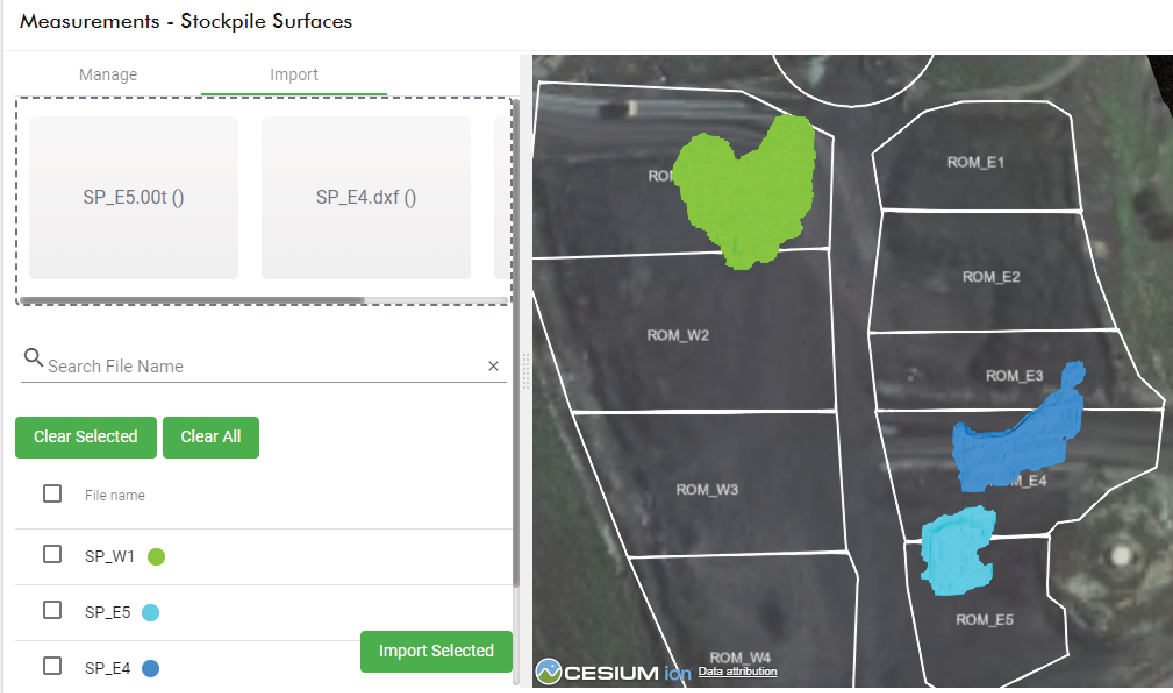
The Measurements - Stockpile Surfaces page allows you to manage and import models called stockpile surfaces. A stockpile surface is a realistic stockpile model derived from scans and other geospatial data sources, usually conformal to the terrain on which it's located and therefore used with a matching terrain surface.
Stockpile surfaces can also be generated from existing stockpiles from the Viewer page using the  tool and made available for other users to import.
The Stockpile surfaces page is arranged into two tabs and a viewer. Select the relevant tab to perform the following:
|
Manage |
Lists the current terrain scans and displays them in the viewer. You can also configure what items to include in the list.
|
|
Add a new stockpile surface as a new or replacement model. Imported stockpile surfaces are accessible to users via the Cross Section tool. The stockpile surface can be used to compare existing models. To learn more, see Viewer > Using the cross section tool. To import stockpile surfaces, follow these steps:
|
 to close the notification.
Lab and Analyser Results
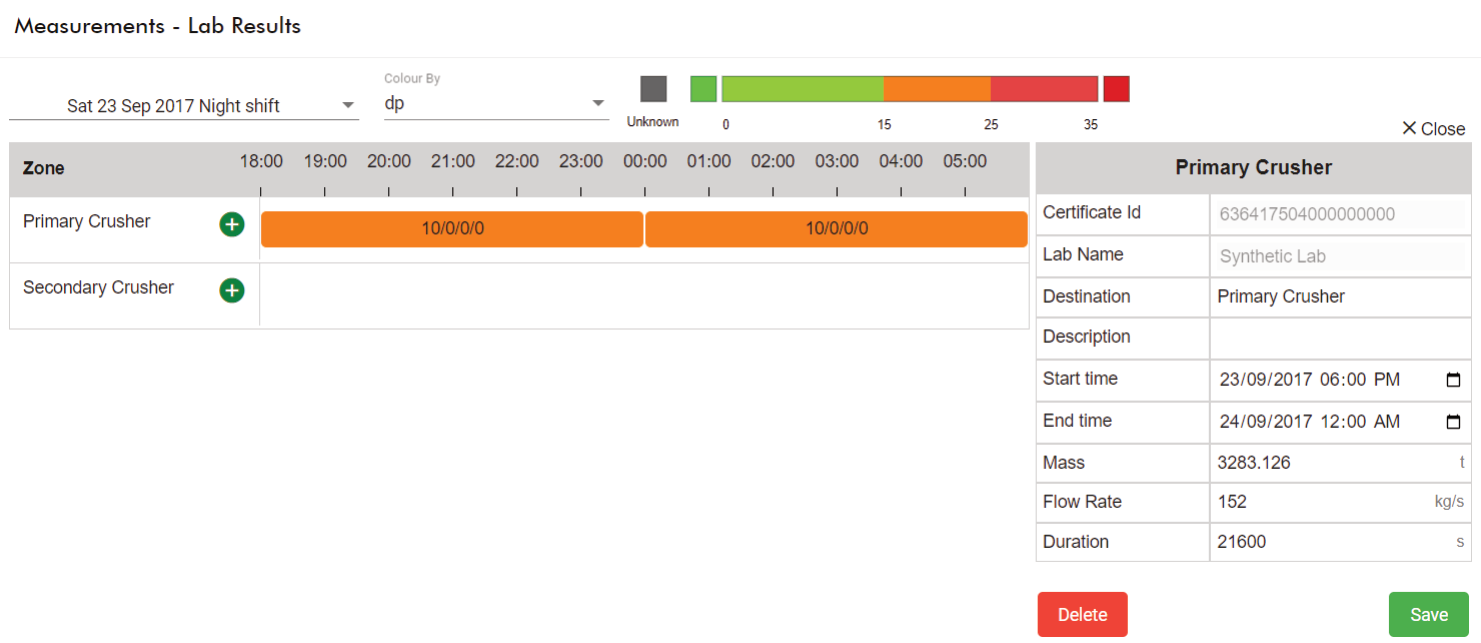
The Labs and Analyser pages are similar in structure. Both display data as time-defined segments along a timeline representing a shift. To view the lab or or analyser results page, select either the Lab Results or Analyser Results page from the Measurements menu. Sinks (containing a lab or analyser), are displayed in separate rows in their respective pages.
-
To select a shift, open its drop-down at the top of the page. If there are lab or analyser results recorded during that period, they will be displayed.
Note: Each segment represents a cycle of processing and receiving a result. Lab results, which are manually performed, typically take longer to process compared to analyser results that operate as an automated system. Thus, the differences between the lab and analyser results appear as illustrated below.
-
To select a colour scheme based on a property type, open the Colour By drop-down and select a property scheme. Additionally, the colour legend of the scheme will be displayed.
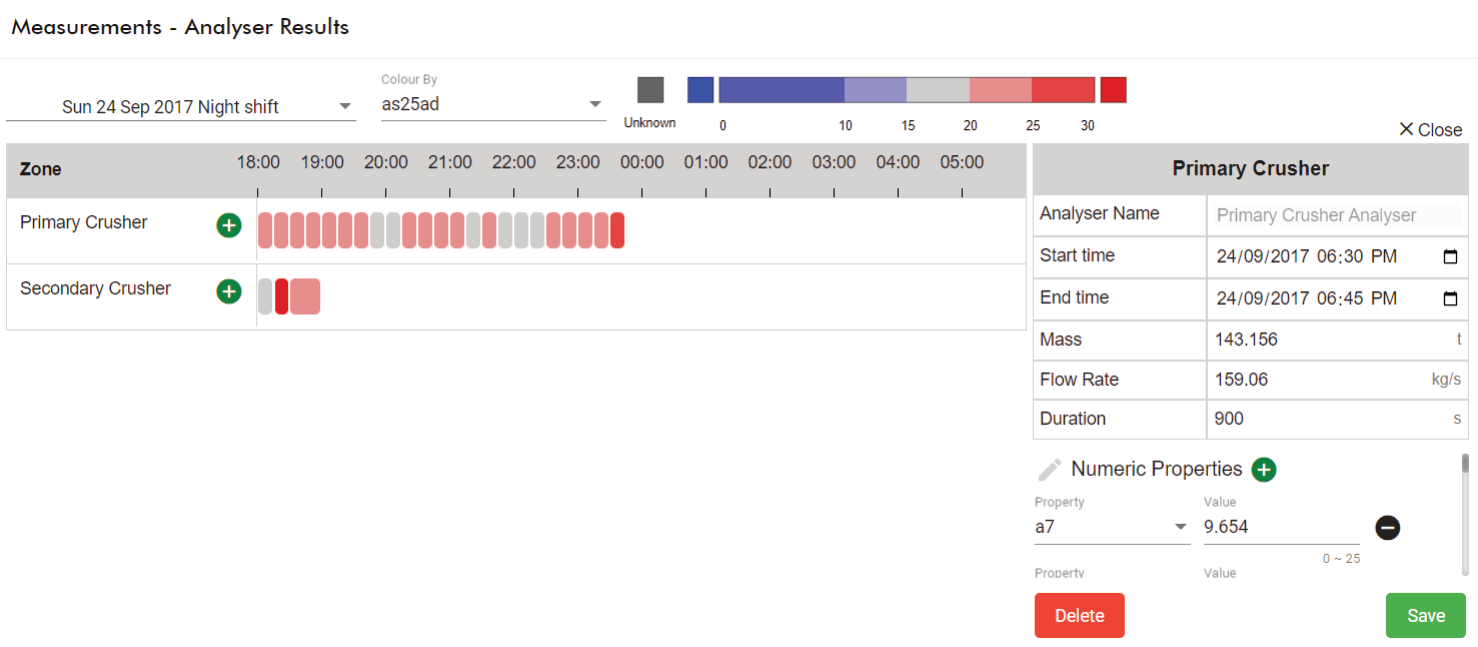
Left: The Lab Results page. Right: The Analyser Results page.
Both the Lab and Analyser pages enable you to view information about a given result.
-
Quickly determine what property types are sampled in each test result. If segments are long enough, they are displayed in the segment itself, for example, 10/2/0/0 is for the number of numeric, text, list, and time properties. For small segments where this text can't fit, hover over it to see a tooltip.
-
To view the details of a result, click on a segment. A panel will open, showing a table, as illustrated.
-
To edit a detail, click in its text field. Note that some details cannot be changed.
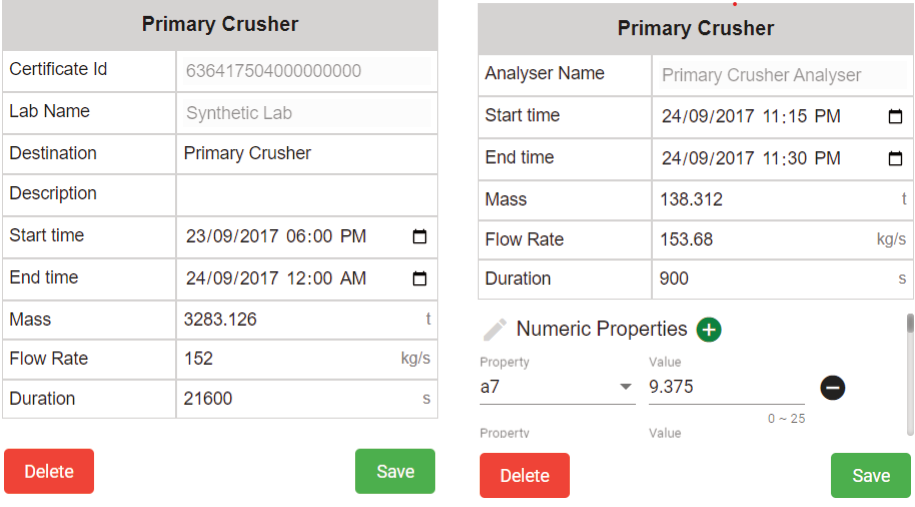
Left: A lab result sample in detail. Right: An analyser sample result in detail
-
To add lab or analyser results manually, select the zone that you want to add it to and click
 (add a new lab or analyser result) in the zone column. This will open the editor, allowing you to add the following information:
Certificate ID
The unique identifier.
Name (Lab or Analyser)
The name of the analyser or lab result.
Destination
The name of the lab or analyser. This field cannot be changed.
Description Optional discretionary text can be added in this field. Start time The starting analyser or lab result date and time (segment). Click to change the individual components of the date and time, or use the calendar picker. End time The ending analyser or lab result date and time (segment). Click to change the individual components of the date and time, or use the calendar picker. Mass Enter the value of the sample mass. If the Flow Rate and Duration values are both entered, the mass will be calculated and entered once you click  .
.Flow Rate Enter the value of material by the quantity of mass per second. If the Mass and Duration values are both entered, the flow rate will be calculated and entered once you click .Duration The duration in seconds is taken from the start and end time. If the Mass and Flow Rate values are both entered , the duration will be calculated and entered, once you click .Properties The type of property (such as text or numeric) is added in this section. Click to add individual properties. After adding them, click .An alert (
 )
will appear in the notification panel when a new result has been added.
)
will appear in the notification panel when a new result has been added. -
To delete an analyser or lab result. Select the segment to open the editor and click
 . A confirmation prompt will open. When sure, click Delete.
