Design Conformance
Source file: design-conformance.htm
Note: Design Conformance is an add-on that requires additional licensing, which may be obtained via your Maptek Account portal. Please see Licensing Applications for details.
The Design Conformance reporting tool allows you to generate reports detailing the conformance between design surfaces and corresponding as-built surfaces.
-
To generate a design conformance report, follow these steps:
-
On the tab, in the Reporting group, click
 Design Conformance.
The Design Conformance Report tool will open on its Specify report data page.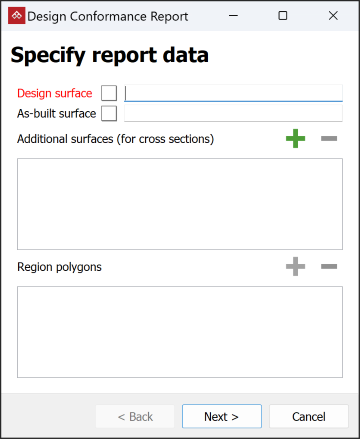
-
Drag the design and as-built surfaces

 into the corresponding fields.
-
If you have created a relevant conformance scene
 using the Create Scene tool (see Create Scene), locate the scene in the project explorer and drag it onto the As-built surface field. This will disable the other fields;
 -
Include additional surfaces for cross sections and region polygons, if required.
Tip: Keep all relevant polygons together in one container. You can then drag the whole container into the Region polygons field.
-
Click Next > to open the Configure report page.
-
Adjust the look of the report and the data that will be included with the following criteria:
-
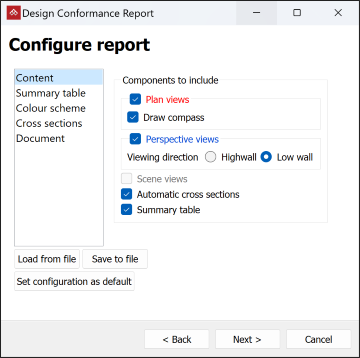
Content: Select components to include with the report.
-
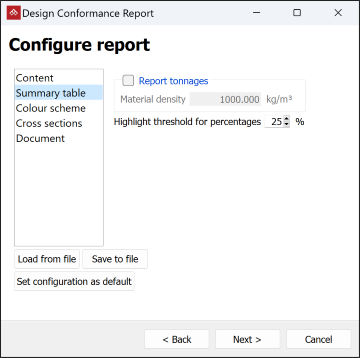
Summary table: Select the details to summarise.
-
Check Report tonnages and enter a material density to report masses instead of volumes.
-
Set Highlight threshold for percentages to define the level at which underdig and overdig results are highlighted.
-
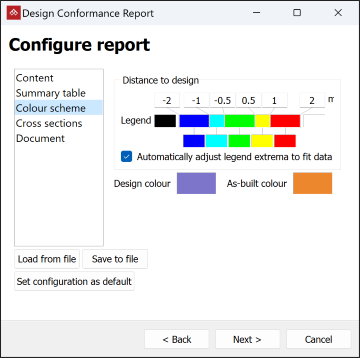
Colour scheme: Set up the colour scheme to reflect the values that will be used in the output. See Modifying a colour scale for detailed instructions.
-
Cross sections: Set up cross section criteria, including vertical scaling and regular fixed grid spacing.
-
Set a suitable Vertical scaling for the cross section charts.
-
Select Fixed grid spacing and enter a value to specify the cross section chart grid line spacing.
-
Select a suitable Layout. For bigger cross section images, choose Bigger sections. For a more compact report, choose Smaller sections.
-
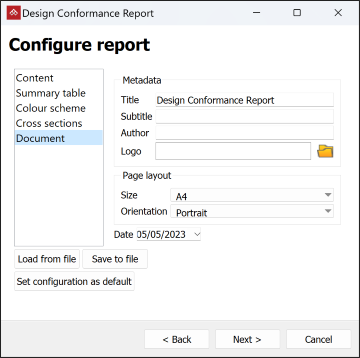
Document: Enter metadata to include (report title and subtitle, author's name, and logo) and a page layout.
 Expand for more detail.
 Expand for more detail.
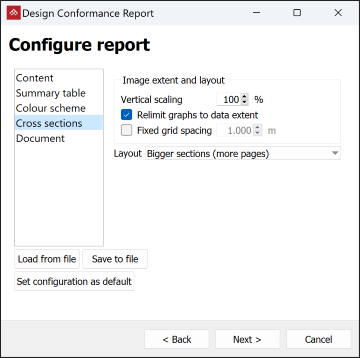
Configure the following cross-section parameters:
Tip: Start with 100%. If they are too tall in the draft report, return to this page and set a smaller value.
-
-
Click Next > to open the Define report area page.
Examine the layouts and adjust them as necessary.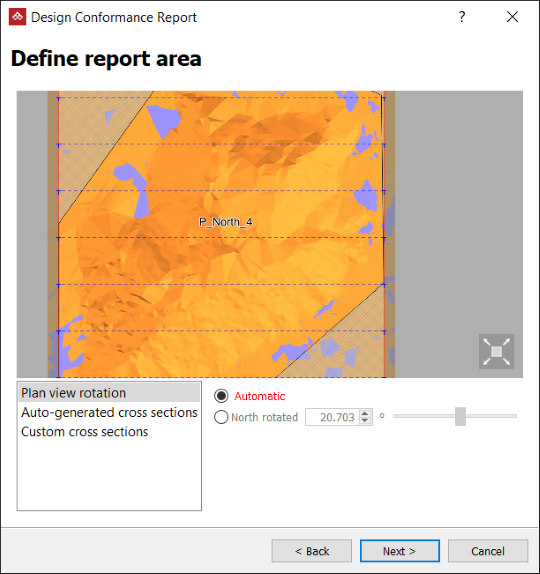
-
Click Next > to open the Review report images page. Review the report images and make any final adjustments, if needed. To do this, click Edit image to open the Windows default image editor.
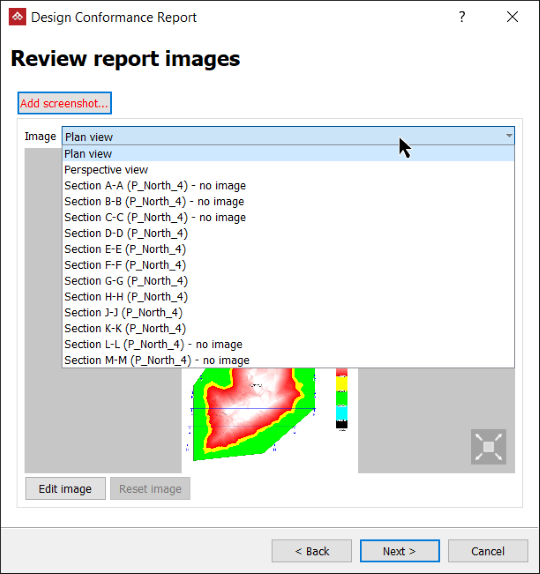
Click < Back to make any other corrections.
-
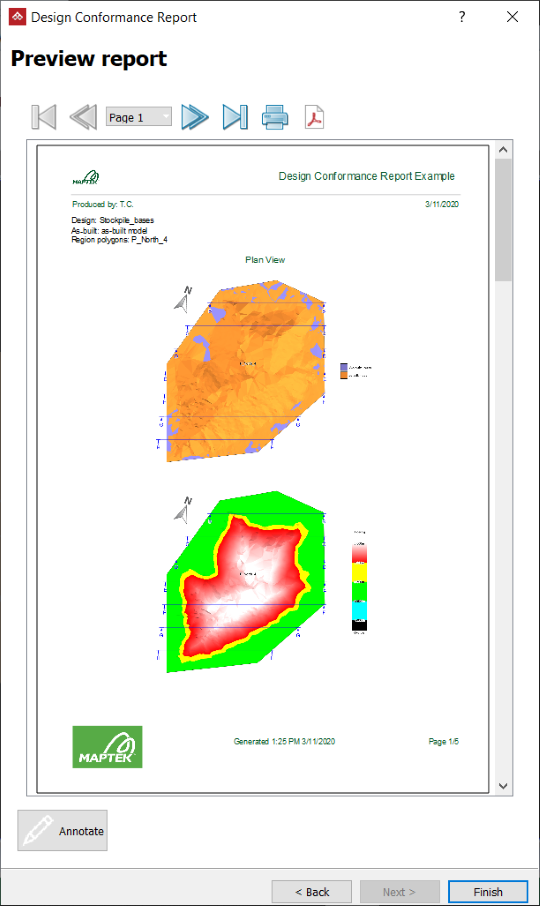
When the preview is satisfactory, click Next > to open the Preview report page. A draft report will be displayed, which you can evaluate:
-
Plan views show the design and as-built surfaces modelled from the supplied objects. Below is a plan view showing only the parts of the as-built intersected vertically by the design, and coloured by distance to the design surface. The colour legend indicates the distances from the as-built to the design in terms of overdig and underdig distances.
-
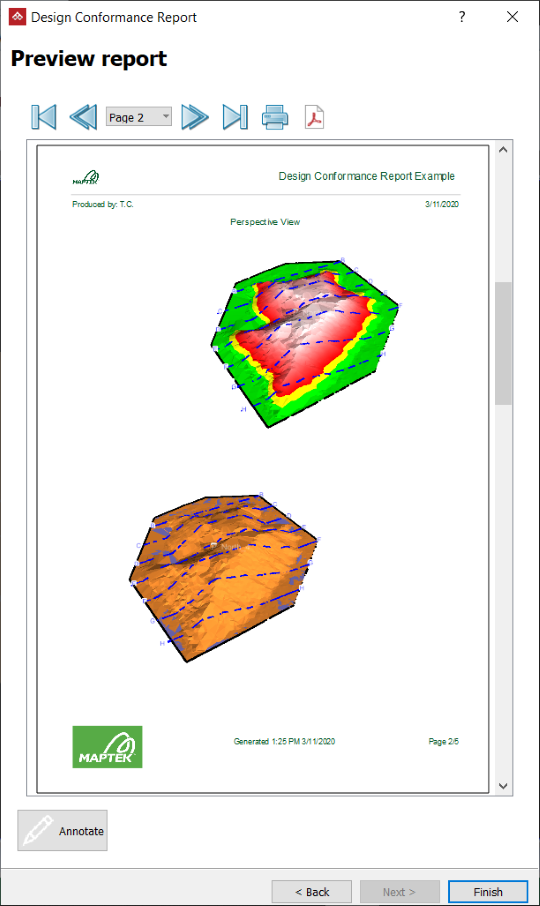
Perspective views show the same data as the plan views, but from a different angle to improve the view of elevated features of the surfaces such as highwalls.
-
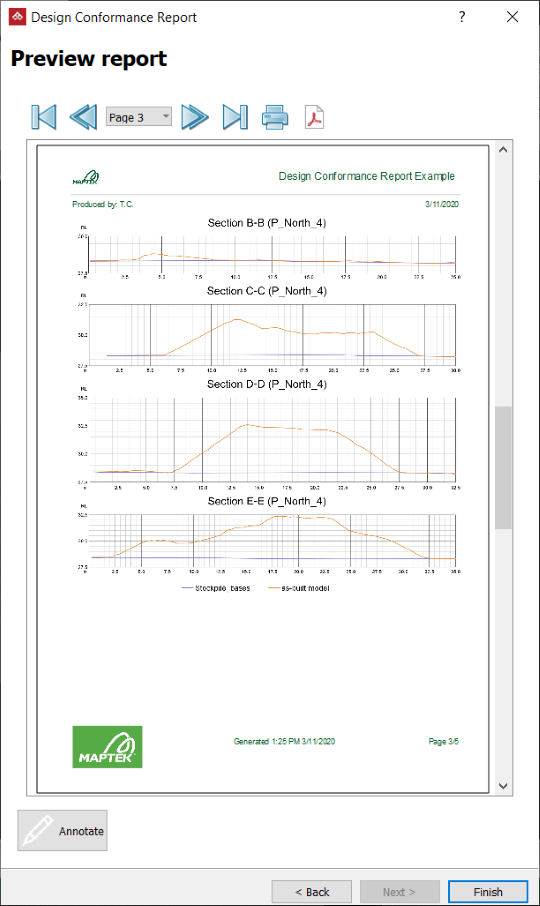
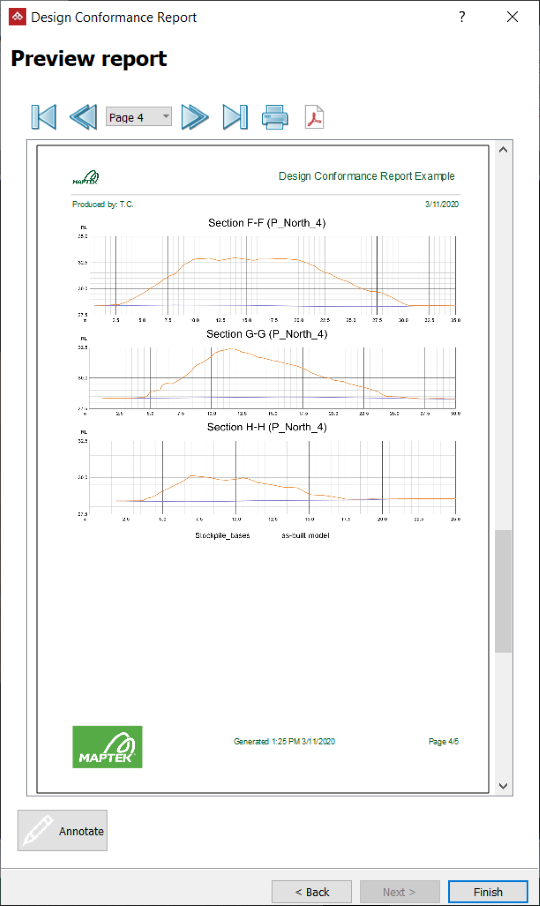
Cross section images show the design vs. as-built in section for each block in the report labelled B-B, C-C and so on.
-
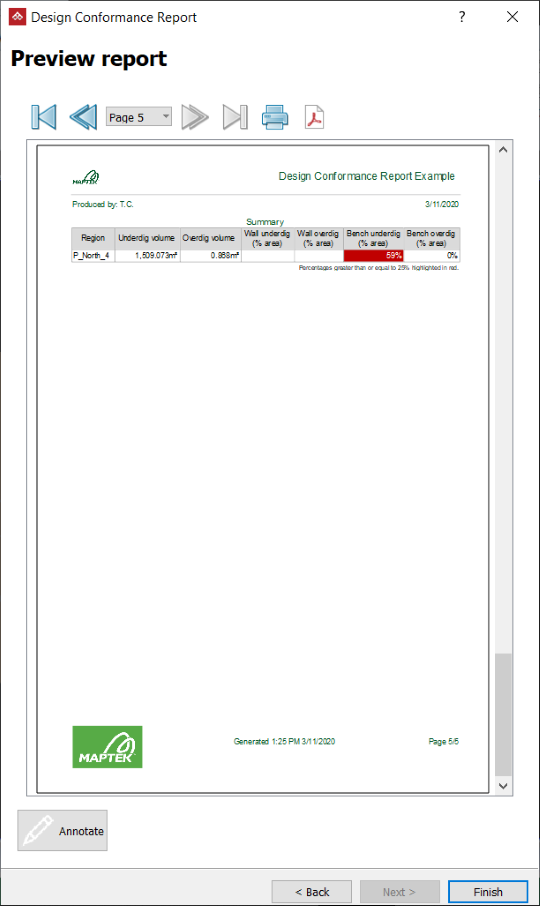
The summary table is presented at the end of the report. It lists conformance statistics for each block in the report, including underdig volume, overdig volume, and overdig and underdig areas splits between wall and bench.
-
Click < Back to make any further changes.
-
Click Annotate to add comments to each section of the report before publishing.
-
Click the
 button to print the report.
-
Click the
 button to save the report as a PDF.
-
Click the
 button to save the report as a CSV or text file.
-
-
-
Click Finish when done.
-