Filter by Columns
Maptek Drive Function - this function is specifically for data from 'driving scans'
This function allows you to filter data from a Maptek Drive 'driving' scan based on choosing specific scan columns. A column is the outwards line of a scan taken each time step, or snapshot, as the vehicle drives around. Stitching the columns (snapshots) together gives the entire 3D point cloud of the area viewed along the driven path.
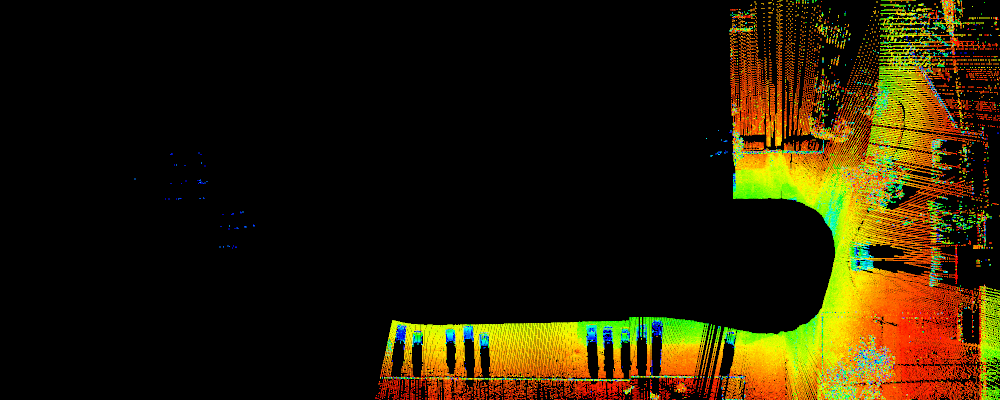
Data from a driving scan will be classified according to accuracy levels of good, fair or poor. Good data is coloured according to original photographic colour, or greyscale colours if there is no photographic data available. Data coloured yellow is considered fair accuracy data. Data coloured red is considered poor data.
- Good points (photographic or greyscale): Highest accuracy data, good for most purposes including calculating positions and volumes.
- Fair points (yellow): Reasonable accuracy. Data can be used for indicating trends and general locations.
- Poor points (red): Lowest accuracy
data which covers the rest of the data accuracy range. This data may
be significantly inaccurate.
The image below shows good points towards the left where the colour includes greys, browns and whites. The fair (yellow) points and poor (red) points can be seen on the right of the image.
-
On the Position and Filter ribbon tab navigate to the Drive group and select
 Filter by Column.
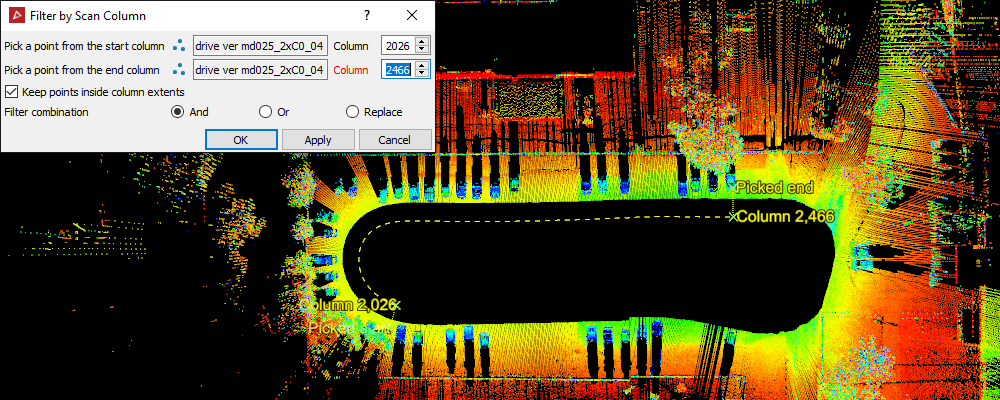
 -
Pick a point from your desired start column.
-
Pick a point from your desired end column.
-
Select whether to keep columns inside the range selection or outside the selection.
-
Choose the appropriate Filter combination if combining with other selected data.
-
Click OK or Apply to complete the action.
You can fine-tune your selection by adjusting the Column numeric field inputs for start and end columns.
Example of a start and end columns selected. Fine-tuning actual column numbers for final selection.
The action applied - Drive data along the selected columns are filtered out of the view.