Fragmentation Analysis and Report
Fragmentation Analysis
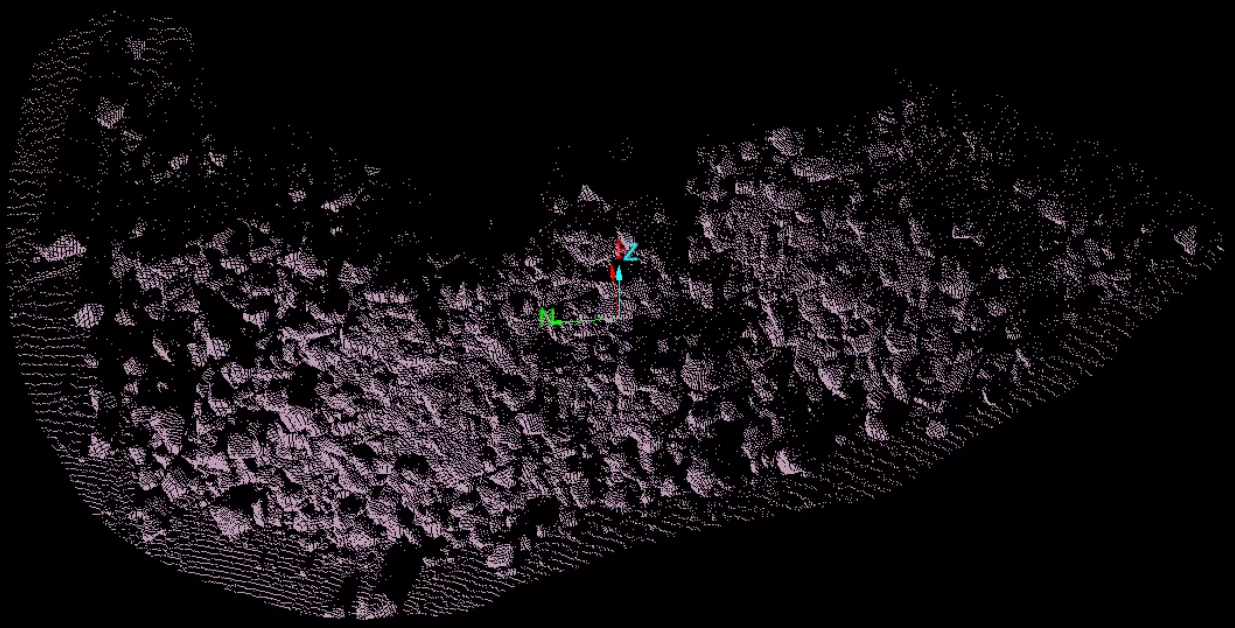
This is a tool for blast fragmentation analysis. It is an automated detection — and analysis of rock sizes from muck pile scans.
Takes a point set of a pile of rocks and breaks down the points into individual rocks and then graphs the resultant distribution of fragment size against the term "% rocks passing sieve".
-
Select the stock pile needing analysis.
-
On the Query ribbon tab navigate to the Fragmentation Analysis group and select
 Fragmentation Analysis.
 -
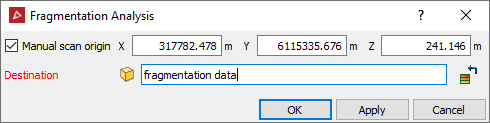
Select Manual scan origin and pick a point in front of the data set.
Important: This is required if there are multiple scans used or a non-scan point cloud data is used for the analysis.
-
Choose an output destination.
-
Click OK.
PointStudio will analyse the fragmentations and export the results into the destination folder.
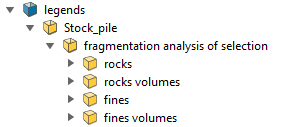
Note: Each time the tool performs an analysis it will iterate the results to the output location.
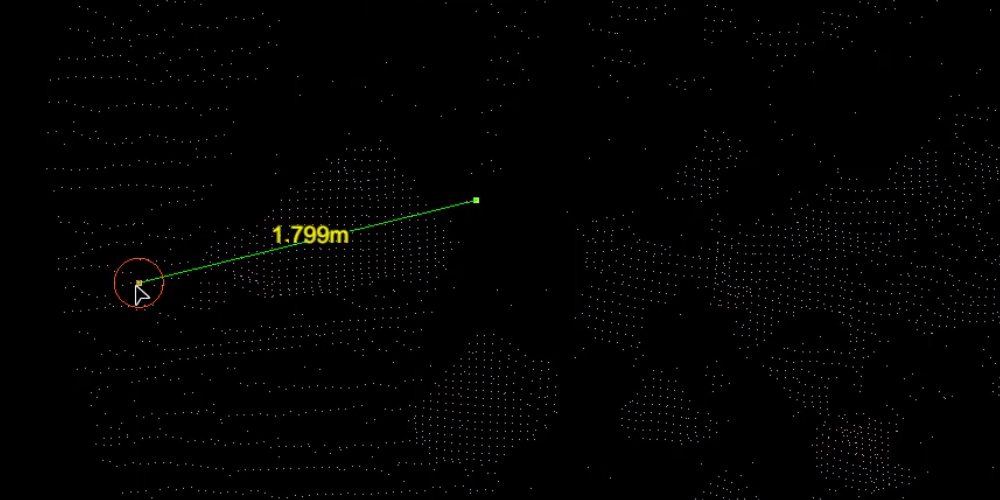
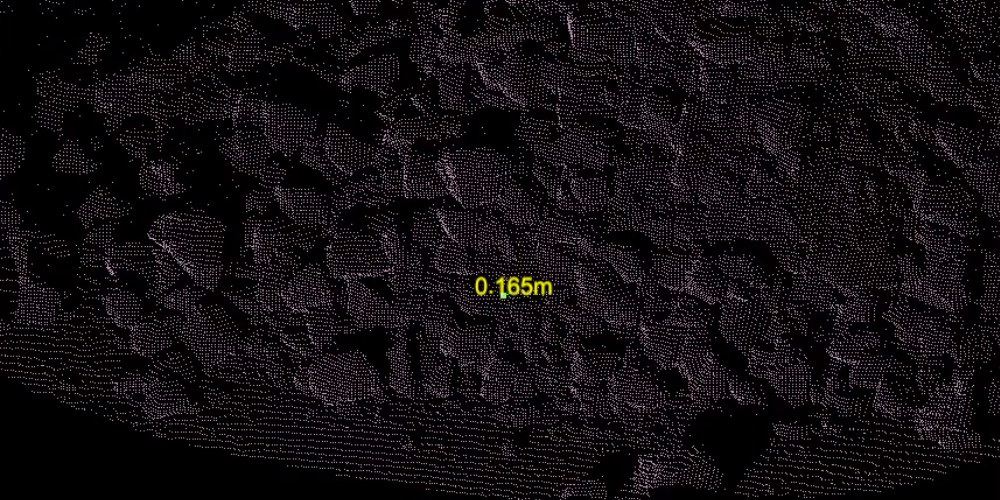
Rocks can be randomly coloured according to different sizes with Ctrl + 2 for a better visual representation.
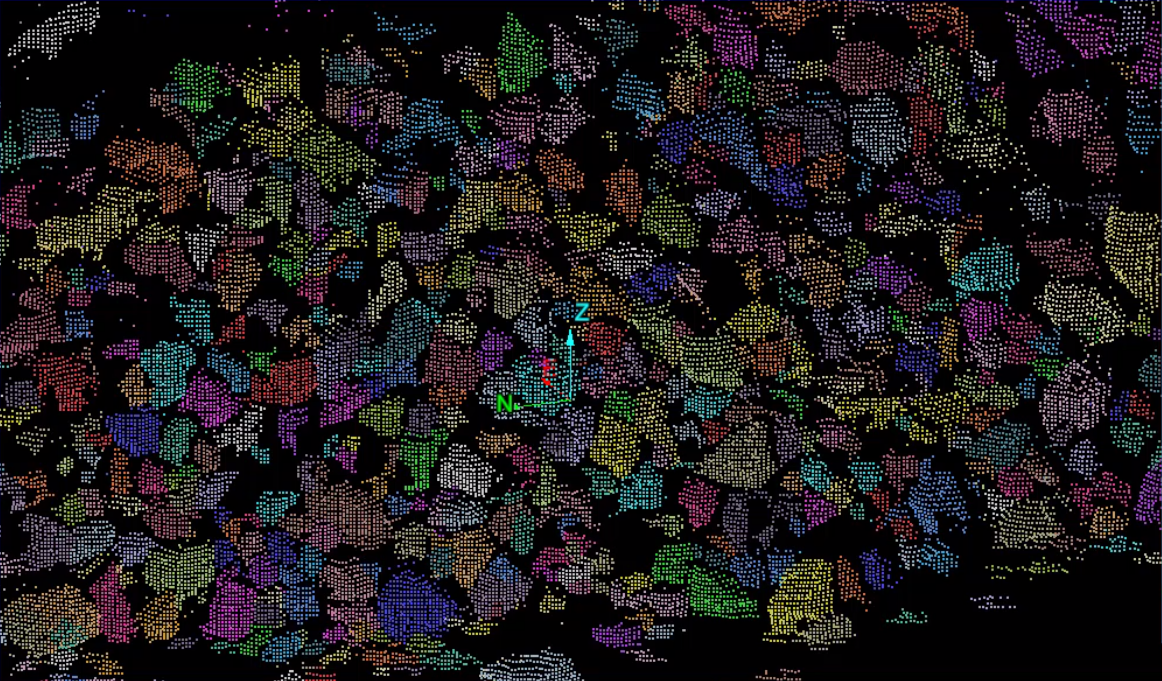
| Find a large sample rock and measure its width to be used in the reporting set up panel. | Find a small sample and measure its width to be used in the reporting set up panel. | |
|
|
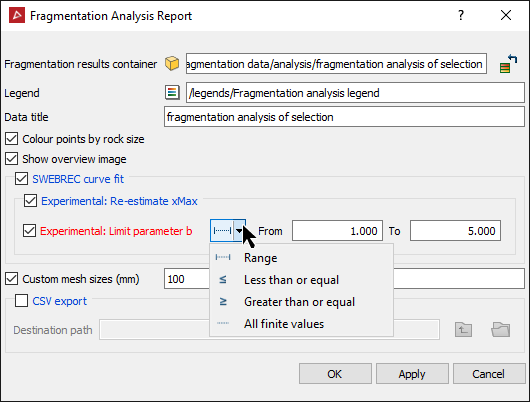
Fragmentation Analysis Report
Following a Fragmentation analysis, selecting ![]() Fragmentation
Analysis Report will generate a report including images and graphs
that can then be exported to PDF or a CSV format.
Fragmentation
Analysis Report will generate a report including images and graphs
that can then be exported to PDF or a CSV format.
-
On the Query ribbon tab navigate to the Fragmentation Analysis group and select
 Fragmentation Analysis Report.
|
|
Below is an example of the Fragmentation Analysis report (first part) graphically displaying the rock sizes and coloured according to the legend.
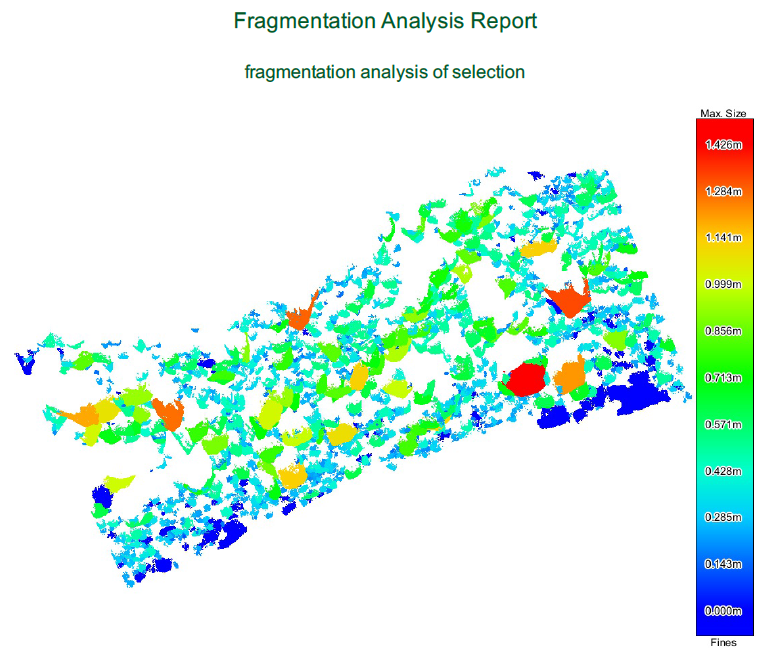
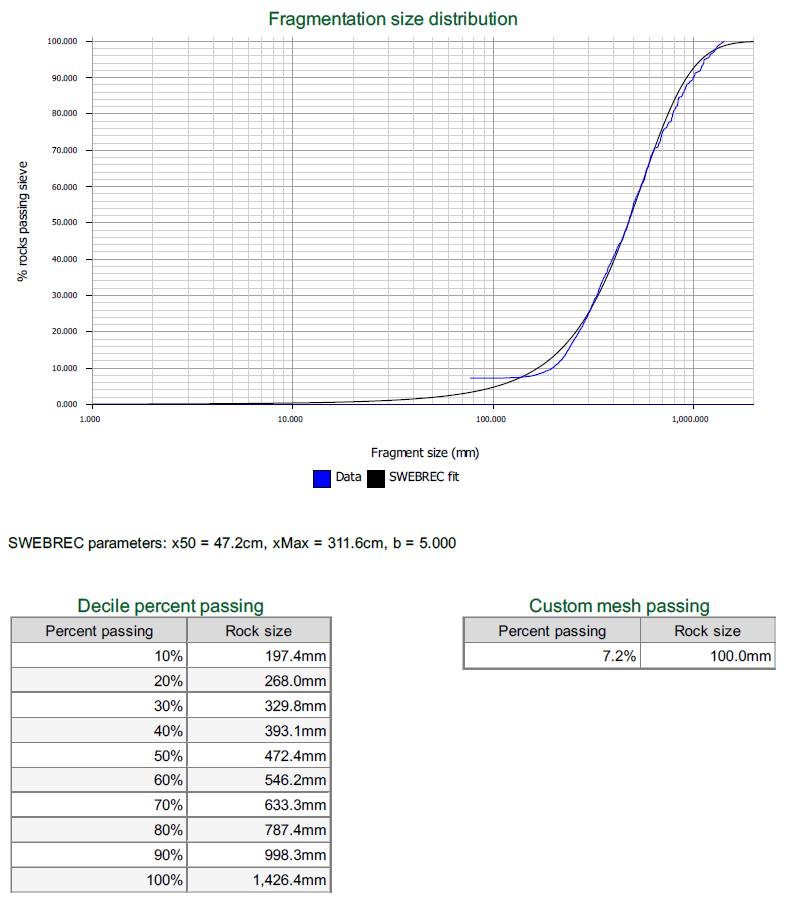
- Fragmentation size distribution as a SWEBREC fit graph and the parameters used for it. (If selected)
- A Decile percent passing table showing you the percentage of rock sizes found. (If selected)
- A Custom mesh passing table showing you what percentage of rocks will pass through a custom mesh size. (If selected)
Example of the Fragmentation Analysis report (second part) that displays the following:
The report can be downloaded by clicking ![]() and or printed by clicking
and or printed by clicking ![]() .
.