To analyse surface change
Analyse surface
change is used to monitor changes in surfaces such as walls, batters and
faces. It uses overlapping surfaces that have been scanned at different
times to display movement and rate of movement.
Note: Before analysing surface change, the
surfaces to be analysed must have an acquisition date set, so that the
relative age of the data can be determined.
-
Ensure the surfaces to be analysed have an acquisition date set.
-
On the Labs ribbon tab navigate to the Obsoleted group and select
 Analyse
Surface Change.
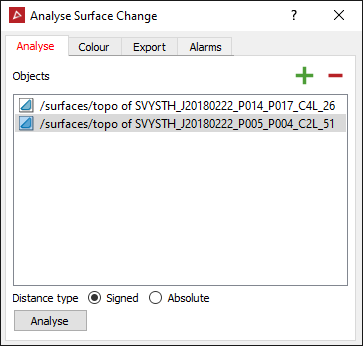
The
Analyse tab is used to specify
the surfaces to be analysed.
-
Using the middle mouse button, drag and drop the surfaces to be analysed into the Objects field.
-
Click Analyse.
The Colour tab enables the analysed surfaces to be coloured based on the movement (or velocity of movement) from a previous surface.
-
Select the Analysed object to be coloured from the drop-down list.
-
Select the Object to measure from (the object with the Previous date or the object with the earliest date (Base)).
-
Select whether to colour the Distance moved or the Velocity of movement.
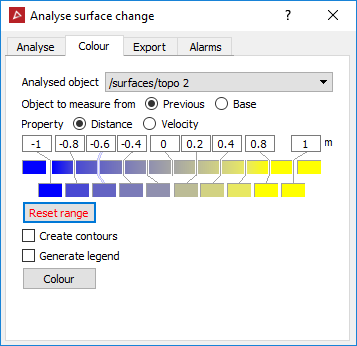
Select the Colour scheme to be used by right clicking on the coloured cells in the colour scheme editor. Several attributes of the colour scheme can be adjusted including the colours of each segment, the minimum and maximum values of the range, and the distance between colour segments. Preset colour schemes are also available.
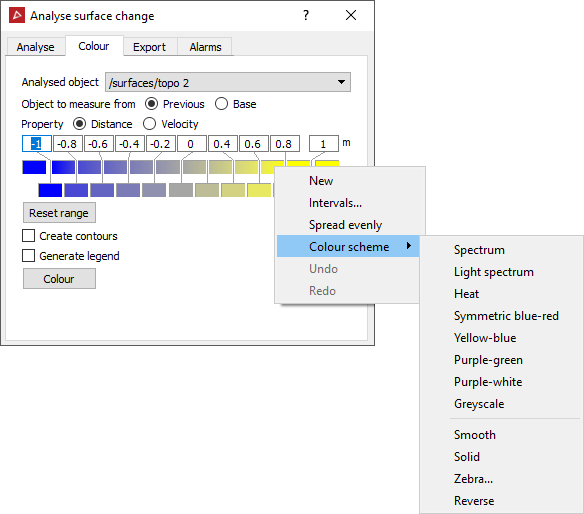
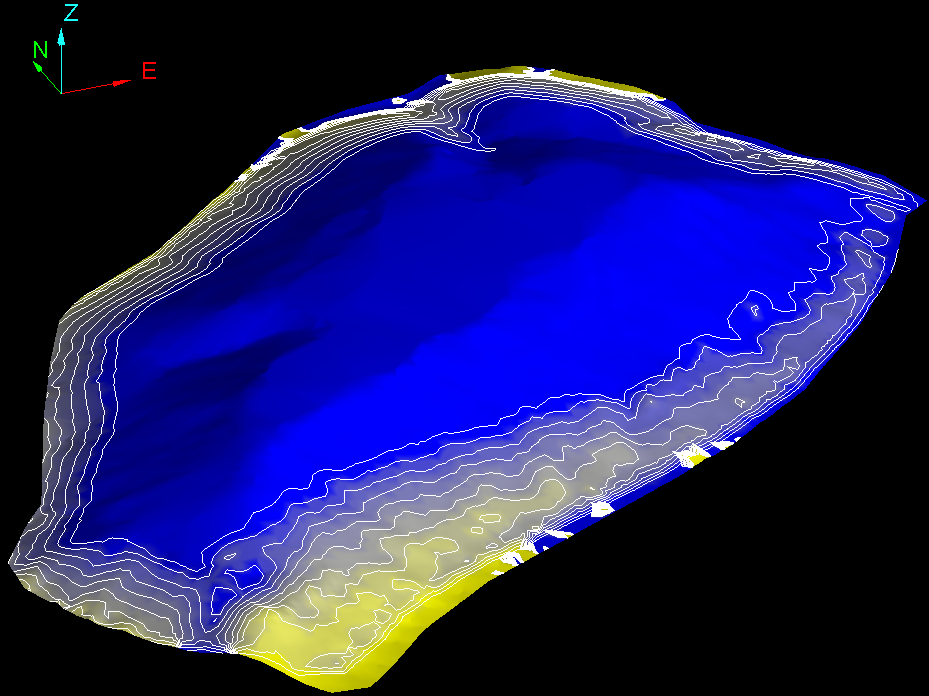
- Create contours applies contours to the colour band boundaries. These are saved in the contours container.
- Generate legend is to create a secondary container containing a histogram of the distance between the objects. This displays which colours were used to indicate specific distance values.
An example of Analyse surface change.
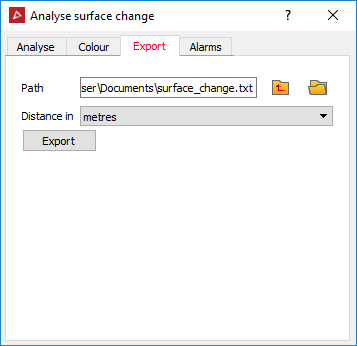
The Export tab enables exporting
the calculated distance measurements for each object to file. This creates
a comma separated text file that displays the x, y, z coordinates for
each point, the distance from the previous surface and the distance from
the base surface.
-
Select the location to save the text file in the Path field.
-
Select the unit to be used for movement from the Distance in drop-down list.
-
Click the Export button.
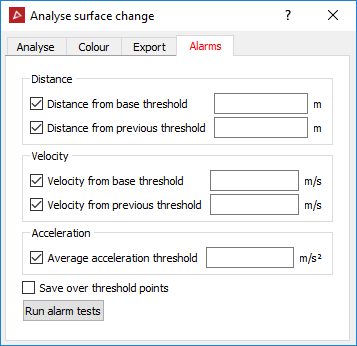
The Alarm tab sets notification thresholds for distance, velocity and acceleration. If these thresholds are exceeded, a message is written to the Report window.
Note: If the alarm thresholds are set before
the Analyse button is clicked
on the Analyse tab, the alarm
tests are automatically run after the analysis.
-
Tick the Distance, Velocity and/or Accelerationcheckboxes to have alarm thresholds defined. (Acceleration requires comparison of at least three surfaces.)
-
Enter the threshold values, over which an alarm will be reported.
-
Tick Save over threshold points to save any points beyond the thresholds as objects in the cad container.
-
Click the Run alarm tests button.
Any points that exceed the defined thresholds are reported in the Report window.