Analyse Surface Change
Source file: analyse-surface-change.htm
The surface
change analyser is used to monitor changes in surfaces such as walls, batters and
faces. It uses overlapping surfaces that have been scanned at different
times to display the amount and rate of movement.
Important: Important: Before analysing surface change, the
surfaces to be analysed must have an acquisition date set, so that the
relative ages of the data can be determined.
-
Ensure the surfaces to be analysed have been assigned an acquisition set. See Set Acquisition Date.
-
On the Home ribbon tab, go to the Colour group and select
 Distance from Objects drop-down.
The Analyse Surface Change panel opens on its Analyse tab.
Expand below for procedures with each tab:
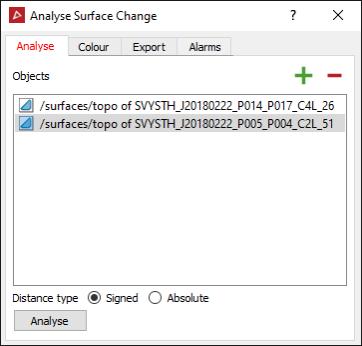
-
Select a surface in the project explorer to analyse. The Object field will automatically populate with the surface.
- Select additional surfaces to analyse and add them to the Objects field, either by dragging or by clicking
 .
. -
Choose a Distance type from the following:
- Signed to distinguish between points in front of or behind the surface.
- Absolute to report only the distance magnitudes.
-
Click the Analyse button.
The surfaces will be analysed, with the oldest one used as the reference or base surface.
Tip: Set up the alarm parameters (see step 6) before clicking Analyse. PointStudio will output alarms automatically with the analysis.
-
Select the Analysed object to be coloured from the drop-down list.
Note: The base object is not included in the list, having the earliest scan date.
-
Select the Object to measure from as either the object with the Previous date or the Base object.
-
Select whether to colour the Distance moved or the Velocity of movement.
-
Select the Colour scheme to be used. See Modify a colour scale for detailed instructions.
Tip: Click Reset range to generate a new numeric scale based on the analysis results. You can then edit these numbers to more practical values.
-
Select or clear the check boxes per requirements, as follows:
- Create contours to apply contours to the colour band boundaries. These are saved in the contours container.
- Generate legend to create a histogram of the distances between the objects in the colours used to indicate specific distance values. The histogram is saved in a secondary container called Colour by surface change legend.
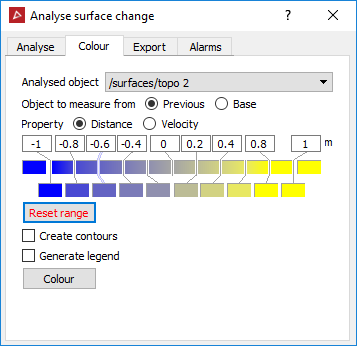
Note: The Colour tab is enabled only after running an analysis.
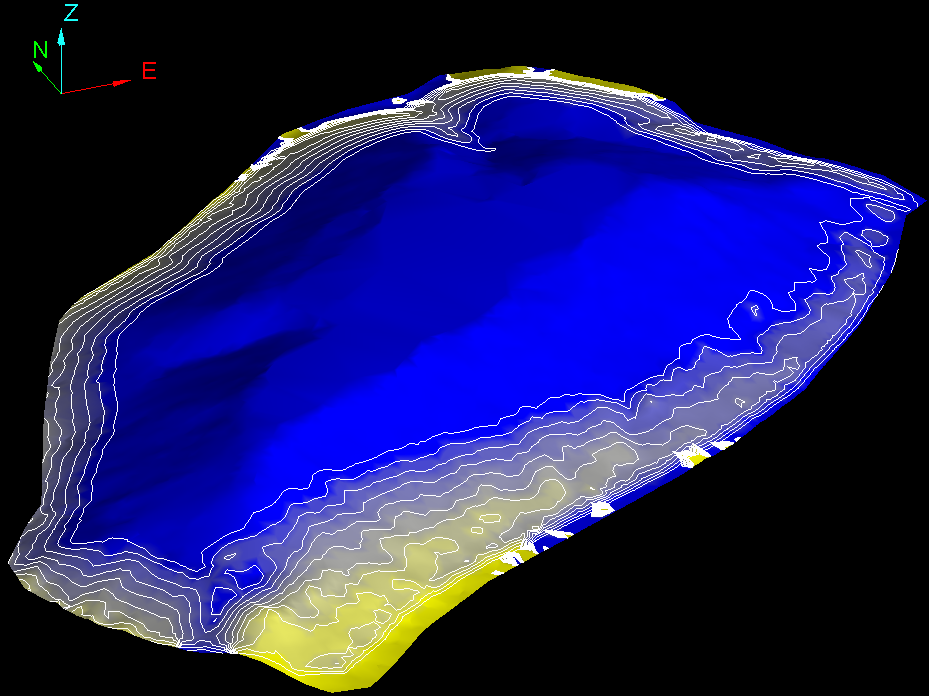
An example of a surface change analysis.
-
Click
 to browse to a Path to save the surface change report text file.
 -
From the Distance in drop-down list, select the measurement unit to be used to record surface movement.
-
Click Export.
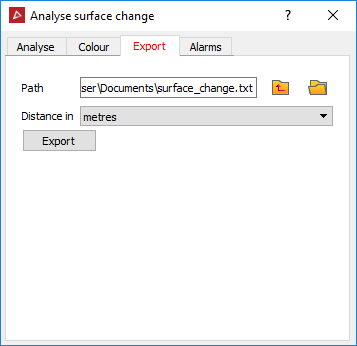
Note: The Export tab is enabled only after running an analysis.
This creates
a comma separated text file that displays the x, y, z coordinates for
each point, the distance from the previous surface and the distance from
the base surface.
-
The Alarm tab sets notification thresholds for distance, velocity and acceleration. If these thresholds are exceeded, a message is written to the report window.
-
Select the required alarm parameters from Distance, Velocity and/or Acceleration.
Note: Acceleration requires comparison of at least three surfaces.
-
Enter the threshold values, over which an alarm will be reported.
-
Select Save over threshold points to save any points beyond the thresholds as objects in the cad container.
-
Click Run alarm tests.
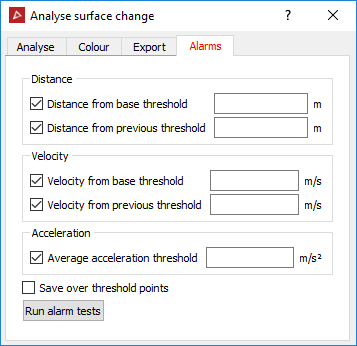
Any points that exceed the defined thresholds are reported in the report window.
