Rose Diagram
Source file: rose-diagrams.htm
The rose diagram tool plots the frequency of data against the direction of the data. It can be used to identify directional trends in the data.
Before creating a rose diagram, you must prepare stereonet data from discontinuities. See Data preparation in Create Stereonet.
Once you have the data prepared, you can create the rose diagram, as follows:
-
Highlight all the created discontinuities in the project explorer.
-
On the Geotechnical ribbon tab, go to the Analyse group and select
 Rose Diagram.
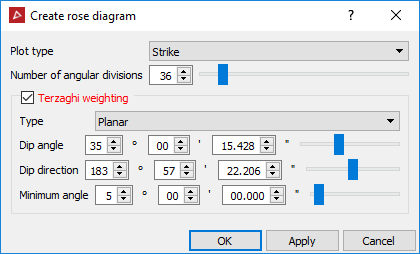
- Select
the Plot type from the drop-down
list (refer to Glossary
for explanations of the plot types):
- Strike direction plots the strike direction of the planes.
- Dip direction plots the dip direction of the planes.
- Trend direction plots the trend direction of the planes.
-
Specify the Number ofangular divisions required in the diagram (range 2-360).
-
Select Terzaghi weighting if desired.
Terzaghi weighting uses the measurement orientation to counteract the sampling bias, the options are:
- The Planar type weighting gives higher weights to discontinuities less likely to intersect the specified plane.
- The Linear type weighting gives higher weights to discontinuities less likely to intersect the specified line.
-
Enter the angle of the Dip angle and Dip direction or use the slider.
-
The Minimum angle is the lowest angle between the measurement orientation and the discontinuity that will be used for weighting.
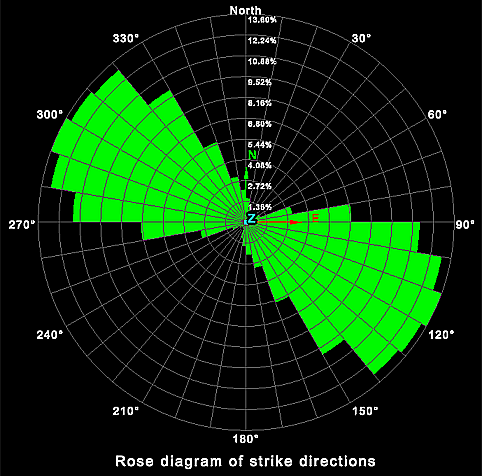
The rose diagram is saved in the geotechnical container.

The direction of the data is displayed around the outside of the diagram and the frequency of the data is displayed in the centre.
