Geometry
Source file: geometry-group.htm
The Geometry group tools enable you to query properties and measurements concerning various primitives.

|
|
Properties (Ctrl+I) Query properties of selected objects. |
|
|
Point (Ctrl+P, Q+pick) Display spatial information about a point in the view window. |
|
|
Distance (Ctrl+Alt+D, D+pick) Measure the distance between selected points. |
|
|
Geometry Measure angles and distances between primitives. |
|
|
Spot Height Query the elevations of selected points. |
|
|
Grade Create a 3D grade annotation. |
|
|
Average Point Spacing Calculate the average spacing between selected points. |
Properties
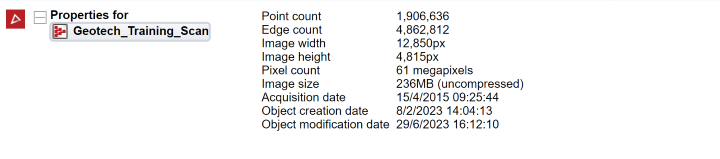
The Properties query (Ctrl+I) enables you to view spatial and other data of any selection, or multiple selections of any type of data.
-
To view data properties:
-
Highlight the data to be queried in the project explorer, or select the data in the view window.
Tip: To query the size of the total project right-click on it in the project explorer and select
 Properties of <project name> from the context menu.
 -
On the Query tab, in the Geometry group, click
Properties.Note: The properties query is also available in the project explorer and view window context menus for objects.
The basic properties of the selected objects will be listed in the report window.
-
Click
Properties a second time to get a comprehensive list of properties.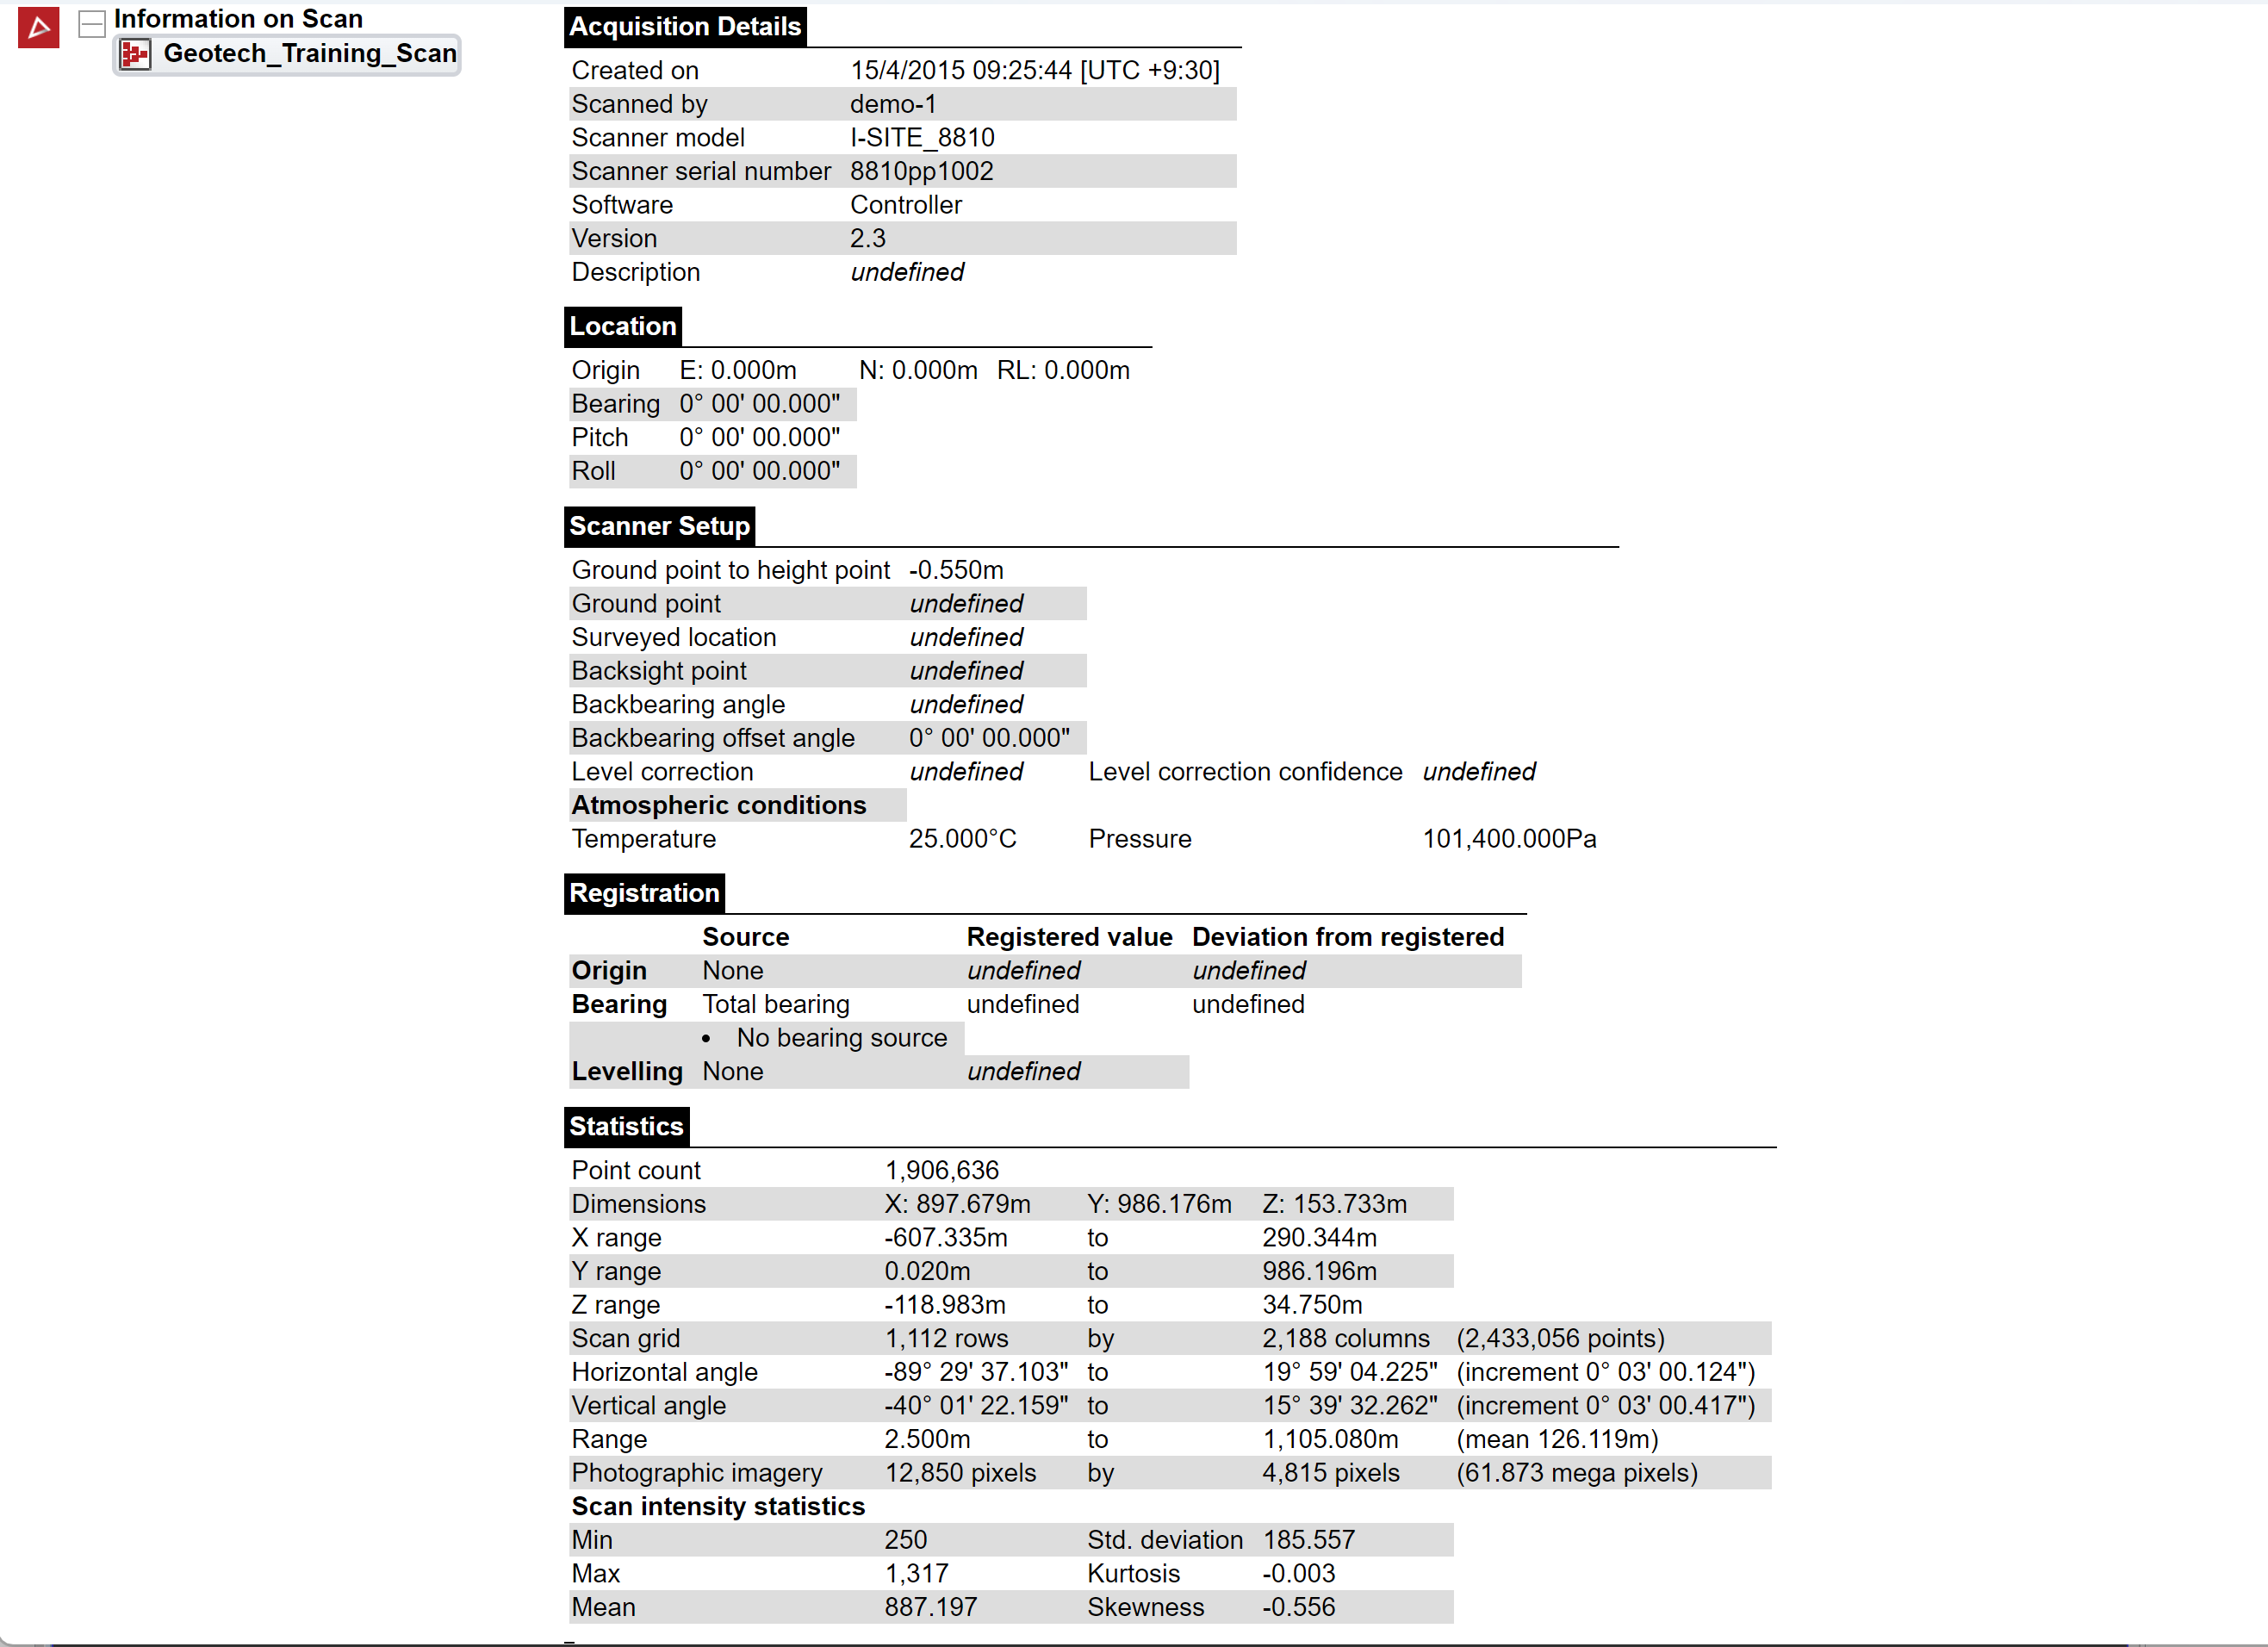
-
Note: This tool is useful for checking scan level correction, particularly when generating scans using the vehicle mount.
Point
The Point query (Ctrl+P, Q+pick) displays spatial information about a specific point in a scan or any other data.
-
To view point properties:
-
On the Query tab, in the Geometry group, click
 Point.
This will launch the point dialog in the status bar.

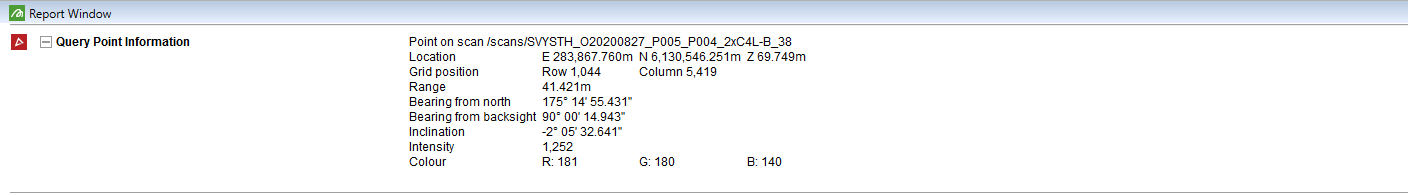
- Click on the required point in the view window. Query Point Information is displayed in the view window and in the report window.
-
The process is repeatable until you click the
 button
or press Esc .
button
or press Esc . -
Press Enter to complete the operation. A Query point summary will be generated in the report window and the Query point information panel will open.
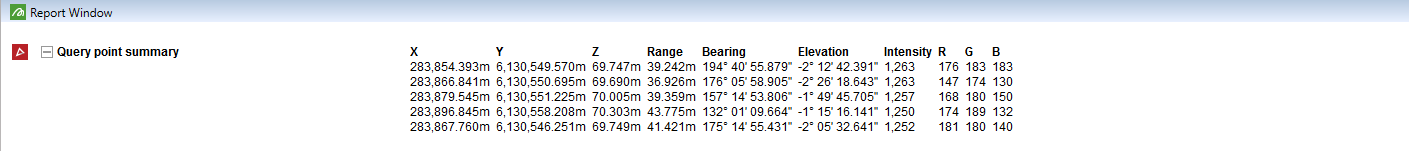
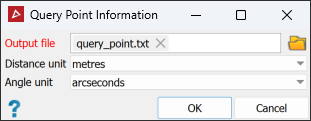

The Query point information panel enables you to save all the point data summaries in a
.txtfile in the specified location. The project location is selected by default. -
Note: When active, this query is displayed in the status bar. While it is active, other operations may be difficult to perform. Best practice is to close the tool when finished. To quit the query, click ![]() in the status bar (bottom left of the screen) or press Esc.
in the status bar (bottom left of the screen) or press Esc.
Distance
The Distance query (Ctrl+Alt+D, D+pick) allows you to measure the distance between selected points. There are two methods for measuring distance. Expand below for instructions on each.
The standard method works like similar queries, and will offer to save the results in a .txt
file on completion.
-
On the Query tab, in the Geometry group, click
 Distance. Alternatively, press Ctrl+Alt+D.
This will launch the query distance dialog in the status bar.

-
Manually enter the first measurement point, or pick it in the view window.
-
Manually enter the second measurement point, or pick it in the view window.
-
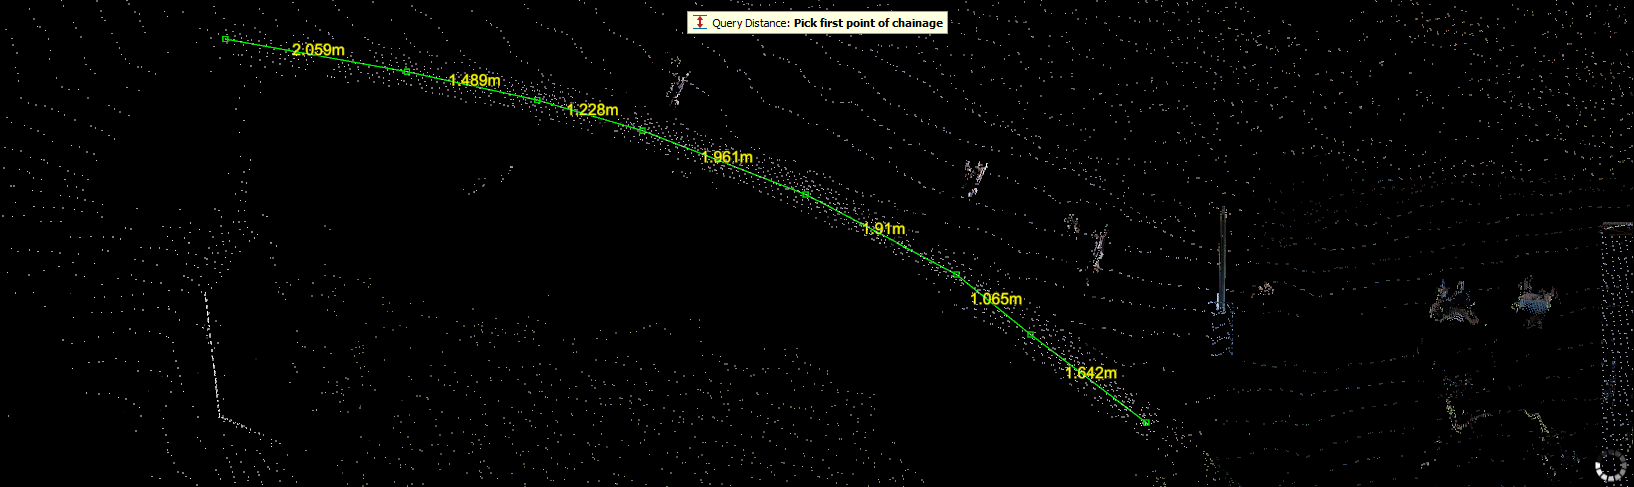
Continue entering or selecting measurement points. Measurements will be added to the view window and the report window for each selected point.
-
Press Enter or the space bar to complete the operation. The Distance tool will close and the Query distance will panel open.


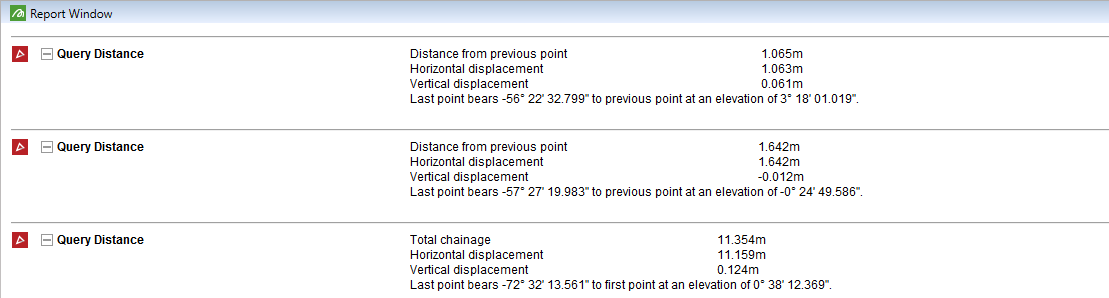
The distance between the points is displayed on the screen and a summary of the measurement is displayed in the report window.
Tip: You can use snap modes for this operation.
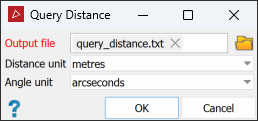
The Query distance
dialog enables you to save all the point data summaries in a .txt
file in a specified folder (the
project folder is selected by default). Click the ![]() button to select a different folder.
button to select a different folder.
The quick method is similar to the standard method, except that it is only active while holding D down and does not offer to save the results.
-
Press and hold D on your keyboard.
The query distance dialog will appear in the status bar.
-
In the view window, pick the first measurement point.
Tip: You can also enter coordinates in the distance query fields while still holding D down.
-
In the view window, pick the second measurement point.
The query result will be displayed in the view window and in the report window.
-
Continue clicking measurement points.
-
Release D when finished.
The results displayed in the view window and the status bar will disappear. However, the results in the report window will remain.
You can save the results to a text file. See Saving the report window information in Report Window.
Note: When active, this query is displayed in the status bar. While it is active, other operations may be difficult to perform. Best practice is to close the tool when finished. To quit the query, click ![]() in the status bar (bottom left of the screen) or press Esc.
in the status bar (bottom left of the screen) or press Esc.
Geometry
The Geometry query enables you to measure the angles and distances between primitives (points, lines, and facets). The first primitive selected is the reference against which all subsequent selections are measured. You can make measurements between different primitive types; results reported depend on the combination of primitive types chosen:
| Point | Edge | Facet | |
| Point | Distance | ||
| Edge | Distance | Distance and angle | |
| Facet | Distance | Angle and intersection coordinates | Angle |
-
To measure geometry, proceed as follows:
-
On the Query tab, in the Geometry group, click
 Geometry to launch the query
geometry dialog in the status bar.
Geometry to launch the query
geometry dialog in the status bar.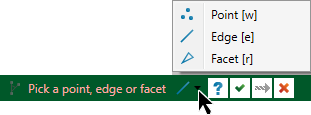
-
From the drop-down menu, select the type of primitive to be used as the reference.
-
Select the reference primitive.
Note: Snap modes are available for selecting primitives.
-
From the drop-down menu, select the next primitive type.
-
Select the next primitive, which will be measured against the reference.
-
Continue selecting primitives to be measured. Results will be added to the report window.
-
When finished, click
to complete the operation.
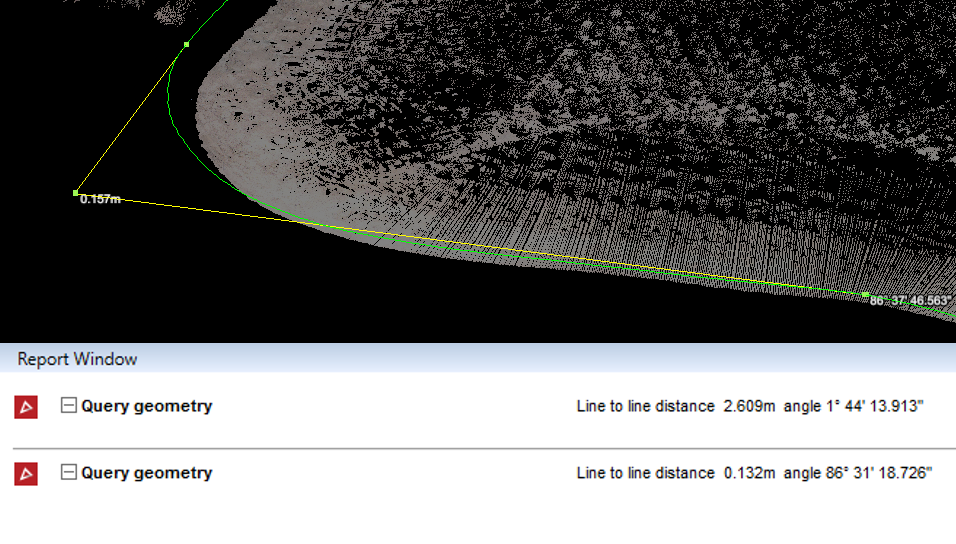
The measurement is displayed in the view window and measurement data are displayed in the report window.
-
Note: When active, this query is displayed in the status bar. While it is active, other operations may be difficult to perform. Best practice is to close the tool when finished. To quit the query, click ![]() in the status bar (bottom left of the screen) or press Esc.
in the status bar (bottom left of the screen) or press Esc.
Spot Height
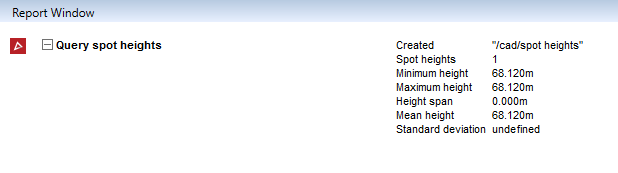
The Spot Height query reports the elevation of a selected point (or points).
-
To query a spot height:
-
Select the points where you wish to indicate spot height.
-
On the Query tab, in the Geometry group, click
 Spot Height.
 -
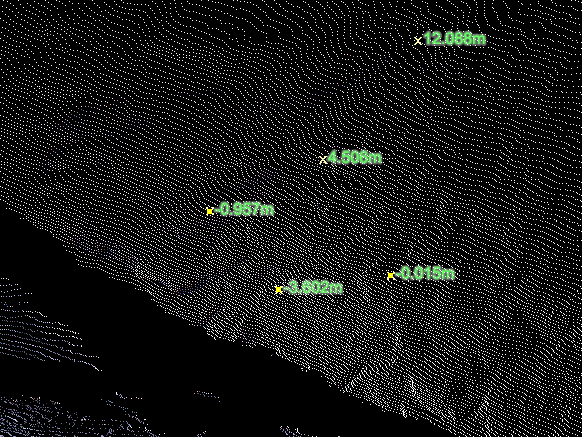
Click
 to display the results in the report window and retain them in the view window.
Note: Results will also be saved as 2D text objects
 in the
 cad container, in sub-containers called
 spot heights <number>. -
Repeat steps 1–3 as many times as required.
-
When finished, click
cancel button or press Esc. -
A summary of spot height data and basic related statistics is also displayed in the report window.
-
Note: When active, this query is displayed in the status bar. While it is active, other operations may be difficult to perform. Best practice is to close the tool when finished. To quit the query, click ![]() in the status bar (bottom left of the screen) or press Esc.
in the status bar (bottom left of the screen) or press Esc.
Grade
The Grade tool allows you to indicate grades (or slopes) at selected regions in the view window.
-
To view a grade:
-
Click
 Grade.
Alternatively, from the Create tab, in the Create group and from the Annotation drop-down list select
Grade.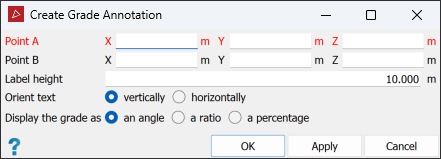
-
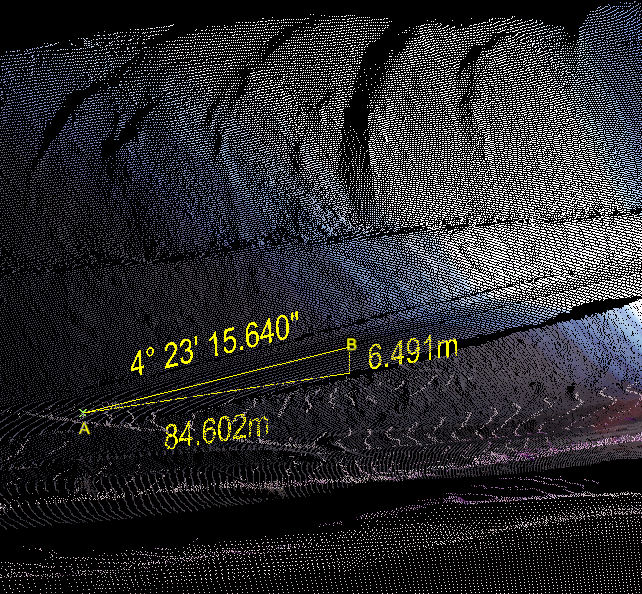
Enter appropriate values into Point A and Point B data fields, or snap to points along where the grade is to be measured and displayed in the view window.
The grade will be displayed as text and an accompanying triangle displaying the vertical and horizontal distances between the points specified.
- Set up and adjust the following aspects of the grade annotation display:
- Label height: Input a value appropriate for the overall display.
- Orient text: Select either vertically or horizontally, depending on which suits the main view angle being used.
- Display the grade as: Select from an angle, a ratio, or a percentage according to your requirements.
-
Select OK or Apply to complete the process.
The grade annotation is saved in a secondary container in the
cad container by default and is displayed in the active view window. A grade annotation consists of 3D text annotations  and a right-triangle loop
  .
.
-
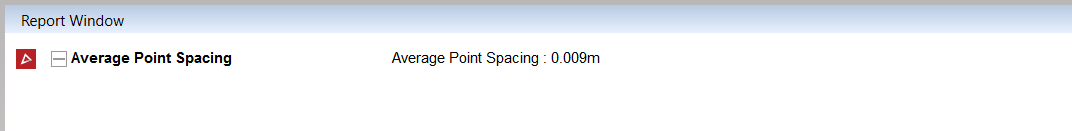
Average Point Spacing
The Average Point Spacing query calculates the average distance between all selected points. There is no tool panel; all calculations occur in the background.
-
To calculate average point spacing:
-
Select any object (a scan, polygon, line or surface).
-
On the Query tab, in the Geometry group, click
 Average Point Spacing.
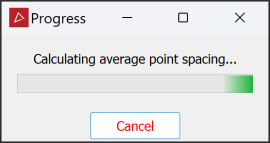
-
When PointStudio has completed average point calculations it will display the result in the report window.