Geostatistical Modelling
Model Variograms
Having calculated the experimental semi-variograms, an equation that best describes the values is found by fitting a curve to these experimental values to simplify further calculations. This curve is a model variogram.
The theoretical models developed to date can be divided into two main groups:
- Semi-variogram models with sill
- Semi-variogram models without a sill
In cases where the semi-variogram increases with distance and levels off to a constant value after a certain distance, hence developing a sill, the following modelling methods are most commonly used;
-
The spherical model
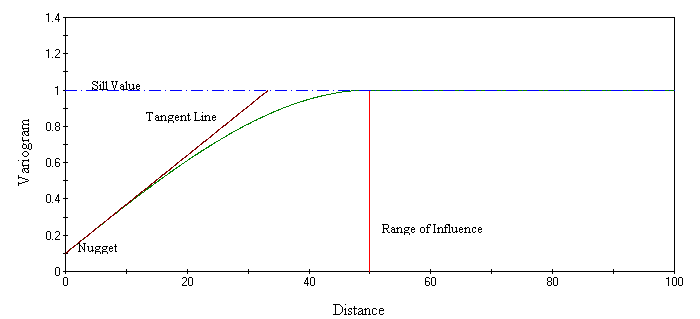
Spherical models have a linear behaviour at the origin and over short distances, then rise rapidly, and gradually curve off (Fig. 7). This is the most commonly used type of model. -
Figure 7 - Spherical Model Variogram
-
The exponential model
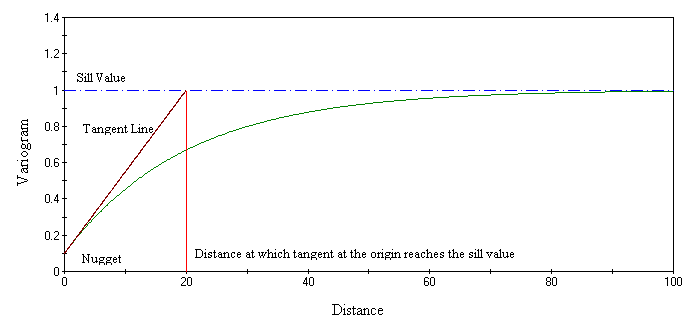
This type of model is associated with an infinite range of influence (Fig. 8). -
Figure 8 - Exponential Model Variogram
-
The Gaussian model
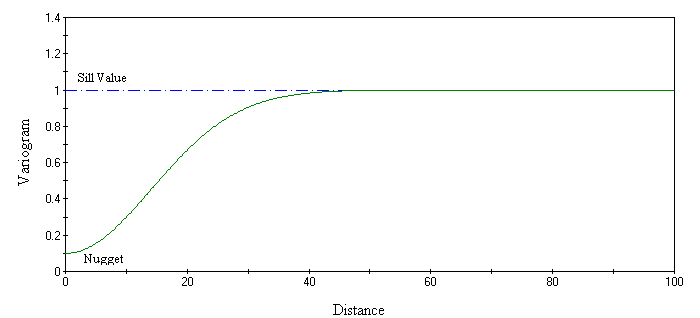
The Gaussian model are associated with a parabolic behaviour at the origin and like the spherical scheme model they rise rapidly, however, unlike the spherical model, which reaches the sill with a definite break, the Gaussian model reaches its sill smoothly (Fig. 9). The Gaussian model characterises a highly continuous environment and is rarely encountered in mineral deposits of any kind. -
Figure 9 - Gaussian Model Variogram
-
The hole effect model
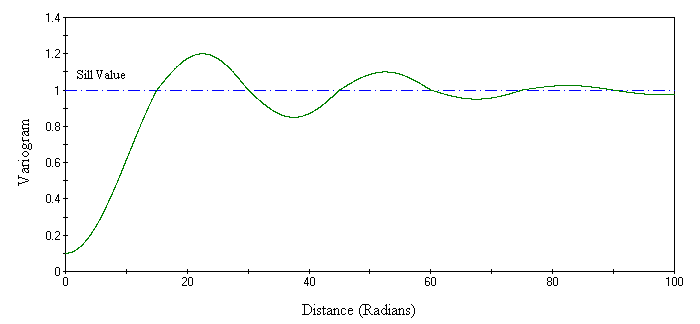
The hole effect semi-variogram models are characterised by their periodic behaviour which is the result of the presence of rich and poor zones (Fig. 10). -
Figure 10 - Hole Effect Model Variogram
In cases where the semi-variogram never levels off with increasing distance. The assay distribution of this kind does not have a finite variance nor can the covariance be defined. The most frequently used models of this kind are:
- De Wijsian model - This is a representation of a linear semi-variogram versus its logarithmic distance (Fig. 11)
-
Figure 11
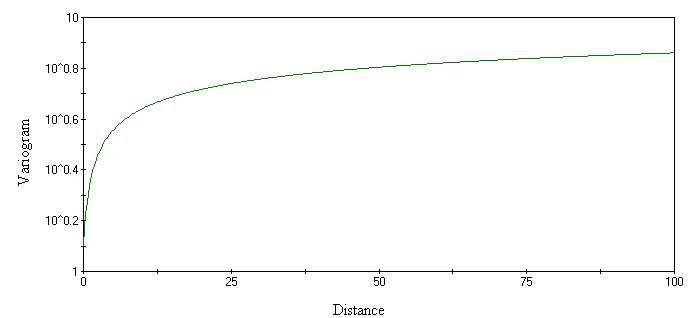
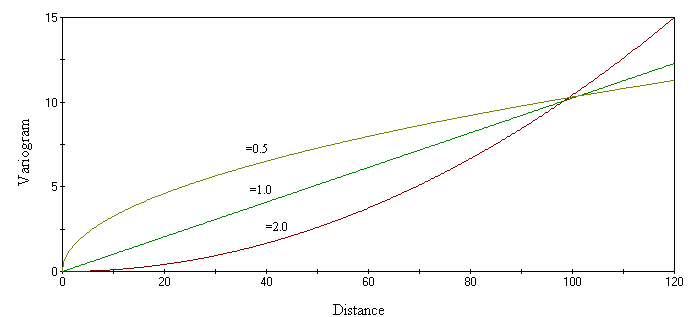
- The linear model - This type of variogram exhibits a straight line, with a slope angle defining the degree of continuity (Fig. 12).
-
Figure 12 - Linear Model Variogram
In any geostatistical interpolation procedure, it is required to use linear combinations of known sample values. It is therefore essential to have the variance of these combinations defined. This is done using the variogram model, which should be able to define the variance at any distance and is required to be positive.

