Overview
The options in the Variography submenu allow you to:- create several styles of experimental (semi) variograms, for example, semi variogram, semi variogram of logarithms, pairwise relative semi variogram, relative semi variogram, indicator semi variogram, cross semi variogram, semi madogram, covariance and correlogram.
- model the experimental variograms using the mathematical modelling functions spherical, exponential, Gaussian power, DeWijsian, linear periodic, gaussian3, exponential31and dampened hole effect.
- use conical sample search.
- define your own graph settings.
- send the variograms to a printer or a file.
- perform zonal variography.
- auto fit the experimental variogram to the variography thus giving you a good starting point for determining your search ellipsoid and orientation.
- store the auto fit parameters in a file for retrieval by grade estimation.
Semi variograms are measures of spatial variability, and as such are the key to any geostatistical study. In the geostatistical process there are usually two types of semi variograms:
- Experimental
Experimental semi variograms are calculated from the data at hand using pre-defined formulae. These variograms can be calculated in various forms, but all replace the Euclidean distancehby the structural distance2g(h).As such, the variogram distance measures theaverage degree of dissimilaritybetween a set of data values a specified distance apart. Usually the separating distance (lag) is varied in a particular direction and theg(h)calculated for each set as defined by the separating (lag) distance (note 1/2 variogram value is approximately a semi variogram). The two functions are plotted against each other in a normal graph defining the change ing(h)with varying separating distances.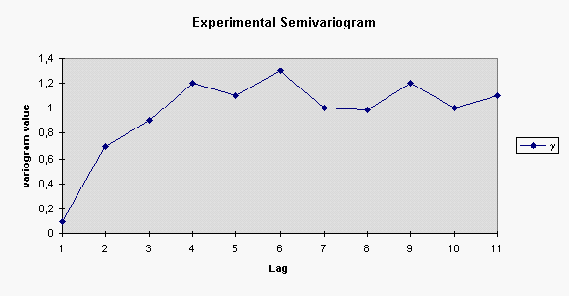
- Model
Model semi variograms attempt to define the shape of the experimental semi variogram, using pre-defined mathematical models. These variograms are smooth mathematical models used to describe best fit mathematical curves for the experimental semi variograms. These are generally described by making use of descriptors, such as nugget effect, range, sill and slope, and are commonly nested features.
For more information on Variography refer to Appendix D, "Geostatistics" and the paper "Geological Overview:Ore Reserve Estimation in Vulcan written by Maptek Brazil - 1997. There are also many excellent text books available on this subject.
1Like the Gaussian and exponential model but three times the effective range must be entered. This is for compatibility with releases prior to V3.3.

