Create Variogram
Create Experimental Variograms
Use the Create Variogram option to define the parameters from which experimental variograms are generated. The experimental variograms catered for are:
- Semi-Variogram
- Semi-Variogram of Logarithms
- Pairwise Relative Semi-Variogram
- Relative Semi-Variogram
- Indicator Semi-Variogram
- Cross Semi-Variogram
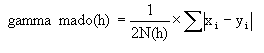
- Semi-Madogram
- Semi-Rodogram
- Covariance
- Correlogram
The sample data used in the generation of the variograms may come from an Isis samples database or an ASCII mapfile. The variogram generation parameters are stored in the <proj><name>.var. See Appendix A for an example:
The resulting variograms are stored in the file <proj><name>.vrs. An example of this file is also provided in Appendix A .
Use the Display and Multi Display options to view the resulting variograms.
Instructions
On the Block menu, point to Variography, and then click Create Variogram to display the Variography Parameter Identifier panel.
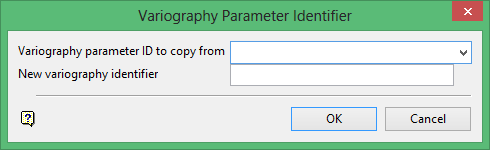
Variography parameter ID to copy from
This is an optional field for the name of an existing variography parameter file. It to copy an existing file and modify the copy to reflect specific requirements for the new parameters.
New variography identifier
Enter the name of the new parameter file. The maximum size is 10 alphanumeric characters.
Click OK.
The following panel is then displayed.
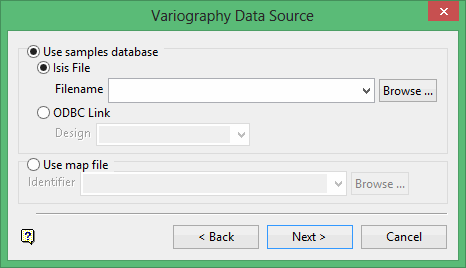
Use samples database
Select this option to use a samples database.
Isis File
Select this option to nominate an Isis database. The drop-down list displays all Isis database files found in your current working directory. Click Browse to select a file from another location.
ODBC Link
Select this option to nominate an ODBC link database. Select the design name from the drop-down list.
Use map file
Select this option to use an ASCII mapfile (.map).
The drop-down list contains all.map files found within your current working directory. Click Browse to select a file from another location.
Click Next.
The following panel is then displayed.
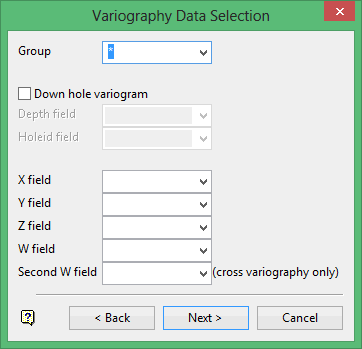
Groups
Enter the name of the group(s) (or database keys) to be loaded. Wildcards (* multi character wildcard and % single character wildcard) may be used to select multiple groups.
Note: Multiple groups only apply to Isis databases. ASCII mapfiles consist of one group.
Down hole variogram
Select this check box to create a down hole variogram. Enter a depth field and hole identifier from the database.
For down hole variography, only the depth of the sample matters and only samples in the same drillhole are compared. This avoids the problems of drillholes collared at the same position. Also, only one direction of variography is calculated (a plunge of -90°). All samples in a given drillhole are assumed to be located in a vertical line.
Note: If you plan to use a triangulation to limit the sample values (see next panel), then you must select values for the X, Y and Z field, else leave these fields blank.
X/Y/Z fields
If down hole variography is not selected, then standard variography in three dimensions is performed. Enter the X, Y, and Z coordinate fields for the samples.
W field
Enter the name of the grade variable.
Second W field
Enter the name of the second grade variable. This should only be entered for cross-variography.
Click Next.
The following panel is then displayed.
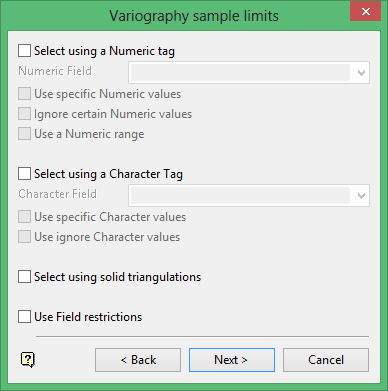
Use this panel to limit the sample values.
Select using a Numeric tag
This method to limit the samples to a numeric field and then only to those entries in this field that have specific numeric values or to ignore those entries. A range of values can also be specified.
For example, you may have a database field named BOUND and the entries in this field are 1, 2 and 3, representing, respectively, ore, waste and internal waste. To use only value 1 (ore) you would check the Use specific Numeric values box and specify 1 as the specific value. The specification of the value(s) is done through the Specific W Values panel, which displays once this panel has been completed.

Example 1 - Specific W Values panel
Ignoring specific values is useful for eliminating certain negative values to be included in your grade estimation. The specification of the value(s) to be ignored is done through the Ignore W Values panel also accessed upon completion of the panel.
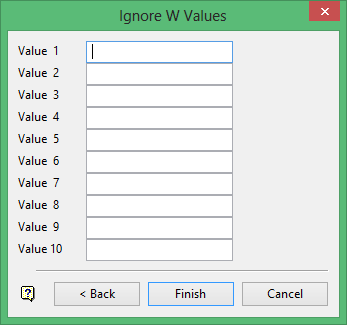
Example 2 - Ignore W Values panel
Up to 10 values can be specified both for inclusion or exclusion in the grade estimation.
A range instead of specific values is useful to ignore a whole range of values, for example, 0 to 9999 to ignore all negative values. It can also be used to ensure any rounding errors are caught, for example, -99 may actually be -99.00001 due to computer storage. The panel for specifying a range is named the Range of Numeric Values panel.
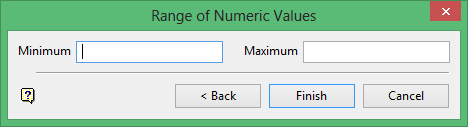
Example 3 - Range of Numeric Values panel
Enter the minimum and maximum for the range.
Select using a Character tag
This method to limit the samples to a character field and then only to those entries in this field that have specific character strings or to ignore those entries.
For example, you may have a database field named BOUND and the entries in this field are ore, waste and internal waste. To use only the character string Ore you would check the Use specific Character values box and specify Ore as the specific string. The specification of the string(s) is done through the Specific Character Strings panel, which displays once this panel has been completed.
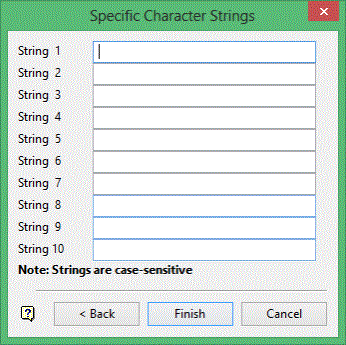
Example 4 - Specific Character Strings panel
Ignoring specific character strings may be useful to eliminate certain strings, for example, waste, from being included in the grade estimation. The specification of the string(s) to be ignored is done through the Ignore Character Strings panel.
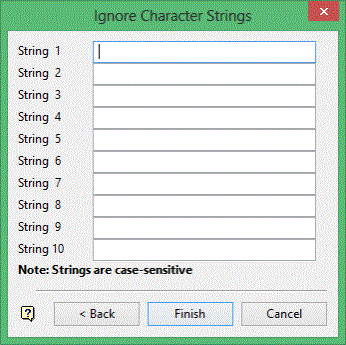
Example 5 - Ignore Character Strings panel
As with numeric values, up to 10 character strings can be specified.
Select using solid triangulations
This method to limit the samples by triangulation and then only those samples that lie in the triangulation. You will be prompted for the triangulation upon completion of the current panel.
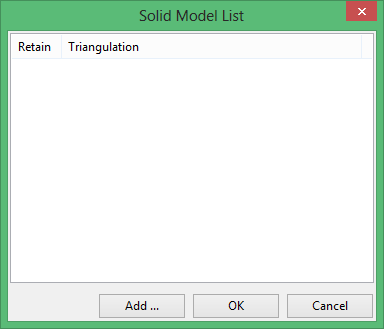
Example 6 - Solid Model List panel
Use Field restrictions
This method to limit the samples to 15 numeric fields and then only samples that match certain selection criteria. Do not use spaces in the condition.
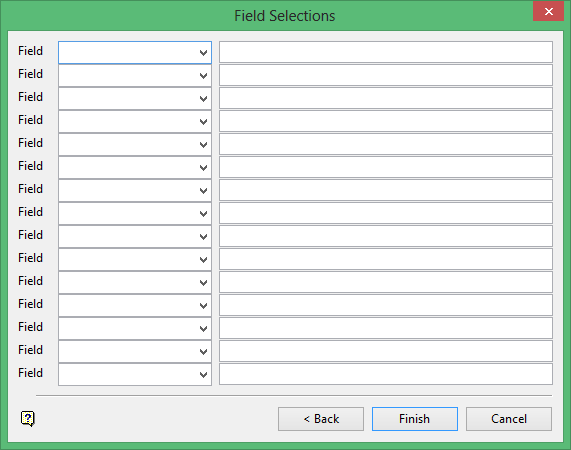
Example 7 - Field Selections panel
The range entered must always have the smallest number specified before the largest number, for example, '-792&-720', since -792 is smaller than -720.
Each option in the above-described methods is accumulated, that is, if more than one option is chosen the samples must satisfy each selected option before being included. Within an option however, selection is based on the OR selection criterion except for field restrictions that allow AND/OR selection criteria.
Click Next.
The following panel is then displayed.
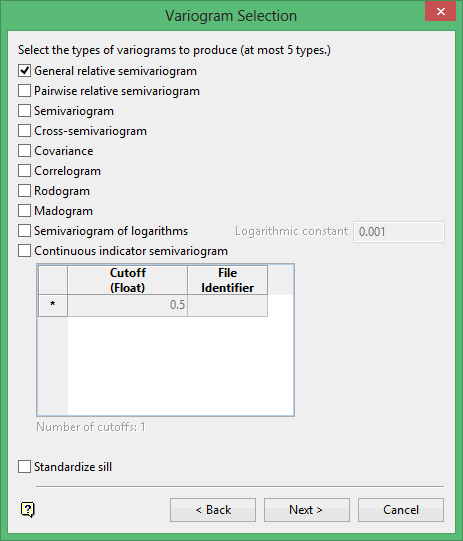
This panel to select the type of experimental variograms to create.
Check the types of variogram to create. There are 10 types available but only 5 can be produced in one variography run.
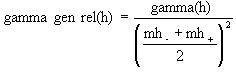
General relative semivariogram
This is like the standard semi variogram, but divided by the mean of the data values.
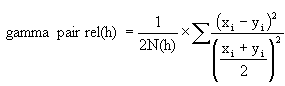
Pairwise relative semivariogram
This is like the standard semi variogram, but each difference is divided by the mean of the sample values.
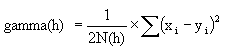
Semivariogram
This is the standard semi variogram.
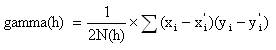
Cross-semivariogram
Covariance
![]()
Correlogram
Rodogram
![]()
Madogram
Semivariogram of logarithms
![]()
Indicator semivariogram
Transform data as 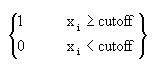 and compute the semivariogram
where:
Standardise sill
Select this check box if you want to standardise the variogram sill by dividing the results by the sample variance. This is useful when calculating a semivariogram because instead of reaching the sill at the sample variance it will reach it at 1.
Click Next.
The following panel is then displayed.
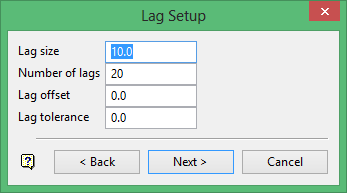
Lag size
Enter the lag size. The variography cone is divided into several lags, or bins, of this size. A good starting size for the lag size is the typical distance between a sample and its nearest neighbour. If you choose a lag size that is too small, many of your lags will have no data, or very little data, and it will be hard to make sense of the results. If you choose a lag size that is too large, you will mix very correlated samples with not so correlated samples and you will not be able to see the range of the sill.
Number of lags
Enter the number of lags or bins to be computed. The more lags, the larger the distance at which variography is computed. In most cases it is unnecessary to compute lags at very large distances.
Lag offset
Enter the lag offset. This is an adjustment factor to locate the position of the first lag. When this offset is set to '0' the centre of the first lag is located at a distance of 0. The position of the centre of the first lag is set to the distance of the lag offset. Normally this is not a significant factor in setting up variography, but it can be set for compatibility with other variography programs.
Lag tolerance
Enter the distance in which to use samples. The maximum size is one half of the lag size. When this is set to '0', a sample pair is put in the closest lag. If this is a positive number, the sample pair must be in this distance of the lag centre.
For example: If the lag size is '10', and two samples are a distance of 23 from each other, then their correlation information is usually stored in the lag at a distance of 20. However, if the lag tolerance was set to '2', then this pair would be ignored since 23 is further than 2 away from 20. Normally this parameter is set to '0'.
Click Next.
The following panel is then displayed.
This panel will not be displayed if you chose to create a downhole variogram (through the Variogram data selection panel).
Variography computes correlations between points in various directions and at various distances.
For any given direction, two points are considered to be located along that direction if a line between the two points is in the angular tolerance limits when compared to a line at the given azimuth and plunge. The two points must also meet the horizontal and vertical distance tolerance limits by being in the maximum distance in the horizontal or vertical directions from a line at the given azimuth and plunge passing through the first point.
The angle and distance tolerances form a truncated cone. Near the origin the cone is expanding. Then, at a certain distance, the horizontal and vertical distance restriction becomes a factor and sides of the cone become flat, parallel sides. See the Diagram 1 for a graphical representation.
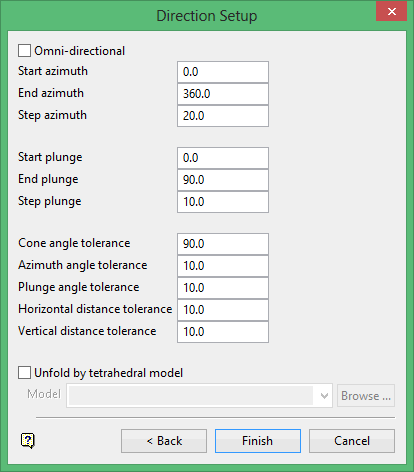
Omni-directional
Select this check box to create an omni-directional variogram, that is, variography will be performed in omni-directional mode. In omni-directional mode only the distance between samples is considered; the angle between sample points is not considered.
Azimuth values
Enter the start, end and step azimuth. These parameters control the azimuth directions in which variography is evaluated.
For example: If the start azimuth is '0', and the end azimuth is '180' and the step is '10', then the azimuths have the values of 0, 10, 20, 30, etc. up to 180, for a total of 19 azimuths.
Plunge values
Enter the start, end and step plunge. These parameters control the plunge directions in which variography is evaluated.
For example: If the start plunge is '0', the end plunge is '-90' and the plunge step is '10', then the plunges take the values of 0, -10, -20, etc. down to -90, for a total of 10 plunge angles. The azimuths and plunges form an array of evaluation directions. If you evaluate 19 azimuth directions and 10 plunge directions, you compute a total of 190 variogram directions.
Cone angle tolerance
Enter the limit on the angle between two samples and the centre line (range axis) of a variogram cone. See the graphical representation in Diagram 1. Any two samples whose angle is larger than this value are ignored. To disable this limit, set it to 90 degrees.
Azimuth angle tolerance
Enter the limit on the angle between two samples as measured in the plane of the plunge of the variogram.
Plunge angle tolerance
Enter the limit on the angle between two samples as measured in a vertical plane in the direction of the azimuth.
Note: A combination of cone, azimuth and plunge tolerances is used if the azimuth angle tolerance and plunge angle tolerance are set to less than the cone angle tolerance.
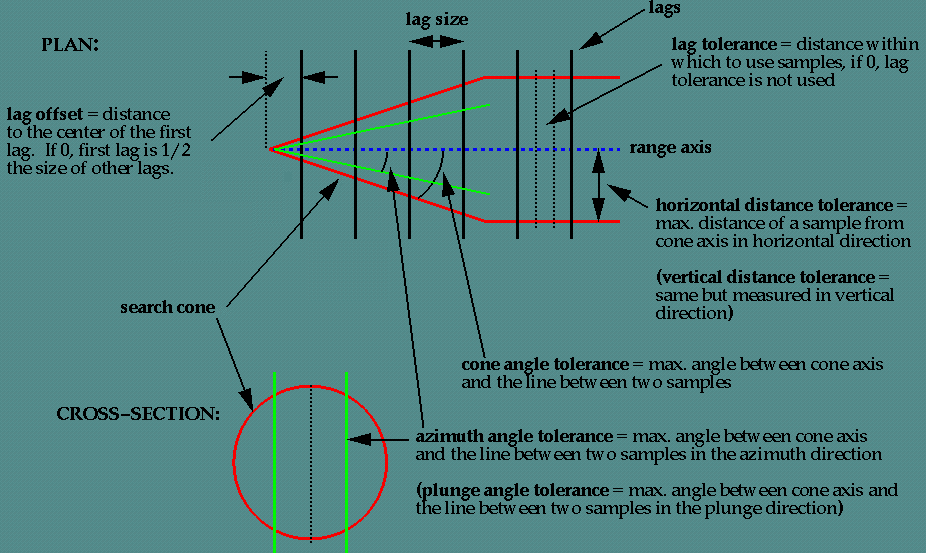
Figure 1 : Graphical Representation
Horizontal distance tolerance
Enter the horizontal distance limit on sample pairs. Any acceptable sample must be in this horizontal distance of the centre of the variogram cone.
Tip: Set this value to a typical spacing (or larger) between your data, for example, if your data is on a 100 × 100 × 10 grid, set a horizontal distance of 100 and a vertical tolerance of 10. If you receive too few sample pairs, try increasing the tolerances to capture more data otherwise artifacts such as "hole effects" may occur.
Vertical distance tolerance
Enter the vertical distance limit on sample pairs. Any acceptable sample must be in this vertical distance from the centre of the variogram cone. The vertical distance is measured from the plane of the plunge of the variogram cone.
Using too large a "cone" can result in excessive mixing of samples from different directions. This can cause the apparent anisotropy to appear smaller than the true anisotropy. Using too small a cone can result in rough variograms that are hard to interpret. The sample cone may be too small if the number of sample pairs for most lags is small compared to the number of sample points.
For anomni directionalvariogram, use 90 for the azimuth tolerance and 90 for the cone angle tolerance.
Note: At a great enough distance, the horizontal distance tolerance and vertical distance tolerance will clip the sides of the search cone.
Unfold by tetrahedral model
Applicable only for folded or faulted block models for which a tetrahedral model has been created. Specify the tetrahedral model.
Click Finish.
The variography is then run in a shell window. Use the Display and Multi Display options to view the resulting variograms.

